Fig. 1
Download original image
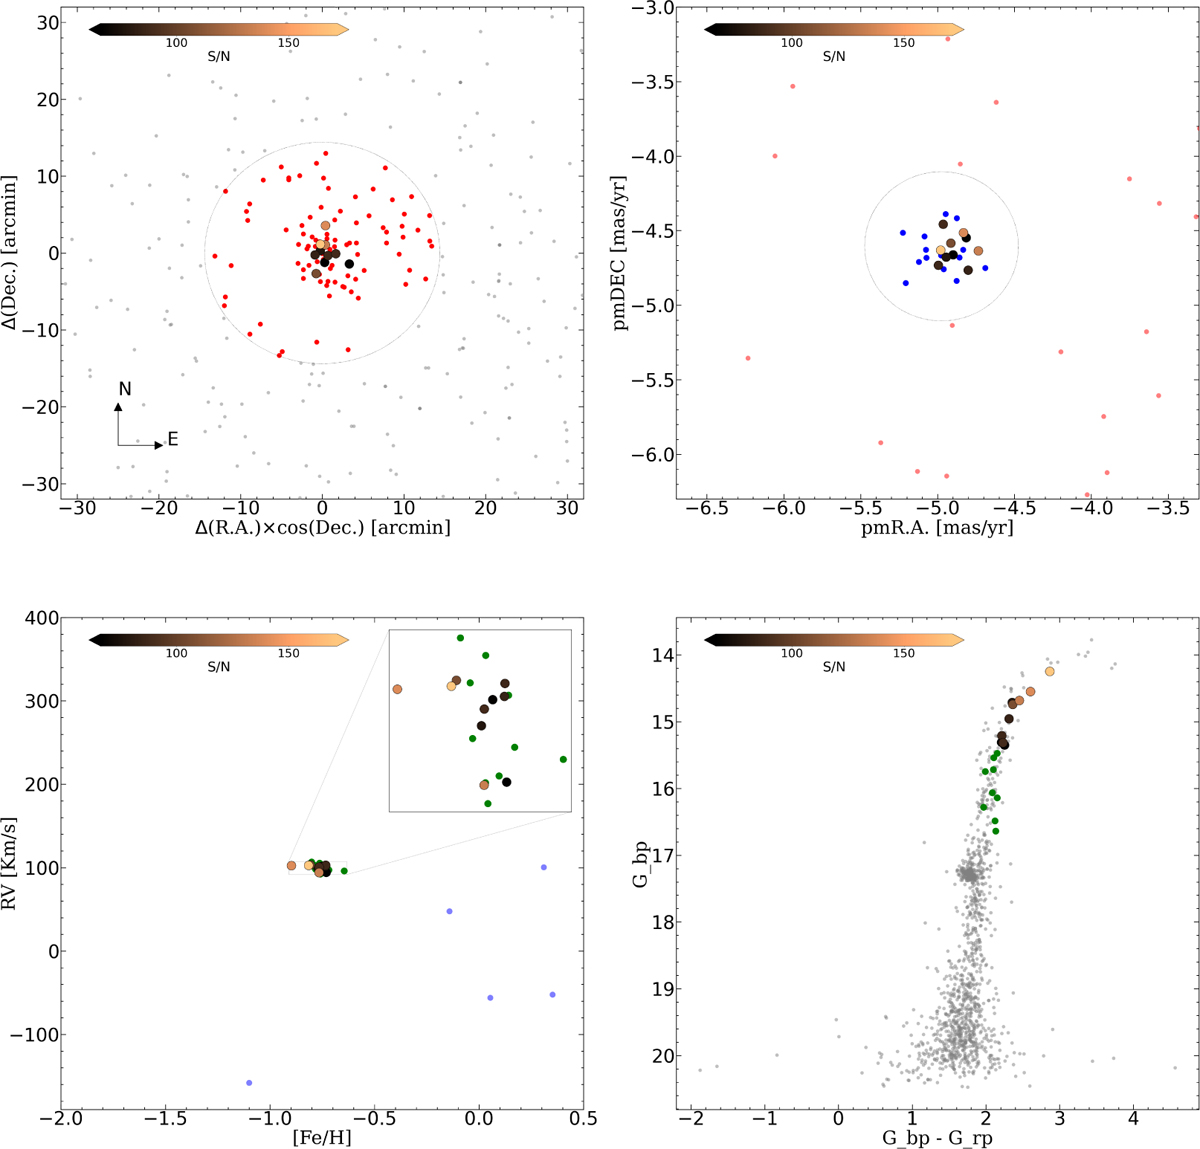
Selection of targets. Top left: selection by position within cluster tidal radius (TR). Grey dots represent field stars, while red dots represent all stars inside the TR. Top right: selection by proper motions. Blue stars represent the stars within the fixed tolerance of PMs, while light red dots represent the stars selected in the top left plot by TR but do not fall within the PM limits. Bottom left: selection by radial velocity and metallicity. Light blue dots represent stars selected in the top right panel by PMs, while green and other colours represent stars selected by their RVs and ASPCAP metallicity. Bottom right: selection by position in RGB and S/N: Green points represent stars that passed all the above criteria but lack the minimal selected S/N, while grey points represent other cluster stars. The final sample is depicted in all plots as bigger circles with a colour-code depending on their S/N.
Current usage metrics show cumulative count of Article Views (full-text article views including HTML views, PDF and ePub downloads, according to the available data) and Abstracts Views on Vision4Press platform.
Data correspond to usage on the plateform after 2015. The current usage metrics is available 48-96 hours after online publication and is updated daily on week days.
Initial download of the metrics may take a while.