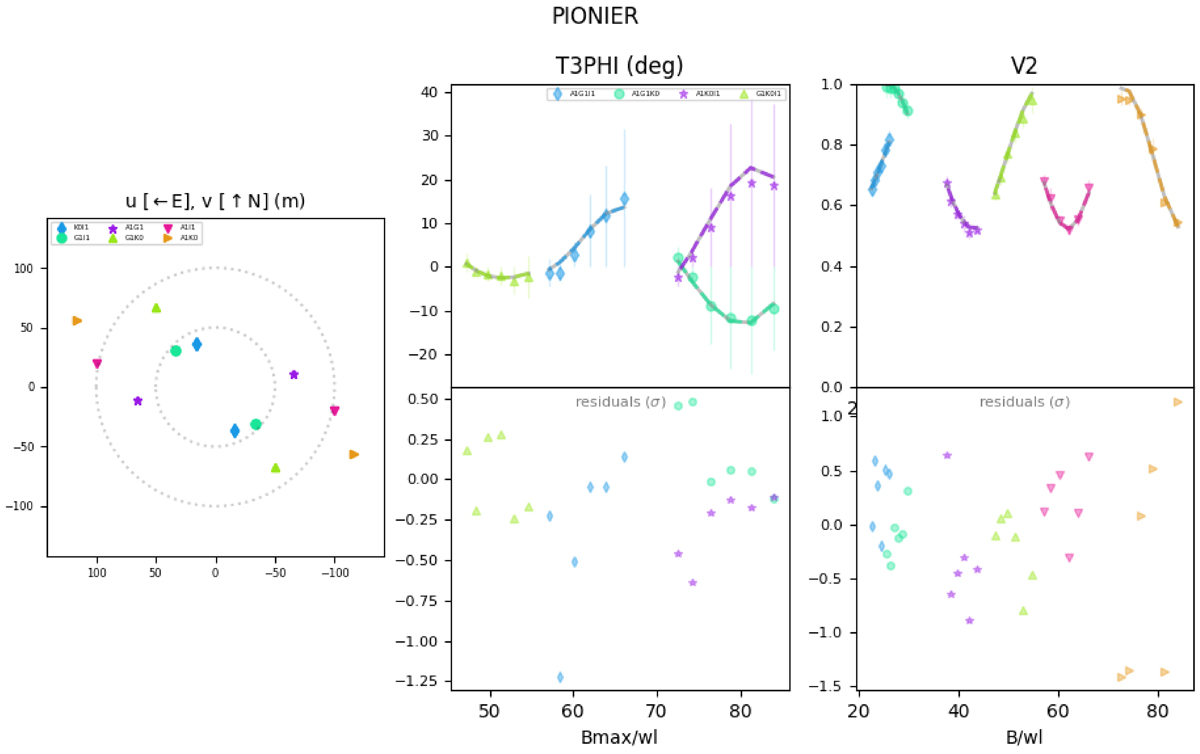
Fig. 1.
Download original image
A typical fit to the data of one of our sources, HD 3379. On the left, we show the u − v coverage of the PIONIER observations. The different colours correspond to the telescope pair with which the particular data were acquired at the VLTI. In the middle, we show the closure phase (T3PHI) fit and residuals in terms of the spatial frequency (Bavg/λ; written as Bavg/wl on the axes). On the right, we show the fit to the squared visibilities (V2) and the associated residuals, again in terms of spatial frequency. The data are represented as points in the fits, whilst the model fits are shown as continuous lines.
Current usage metrics show cumulative count of Article Views (full-text article views including HTML views, PDF and ePub downloads, according to the available data) and Abstracts Views on Vision4Press platform.
Data correspond to usage on the plateform after 2015. The current usage metrics is available 48-96 hours after online publication and is updated daily on week days.
Initial download of the metrics may take a while.