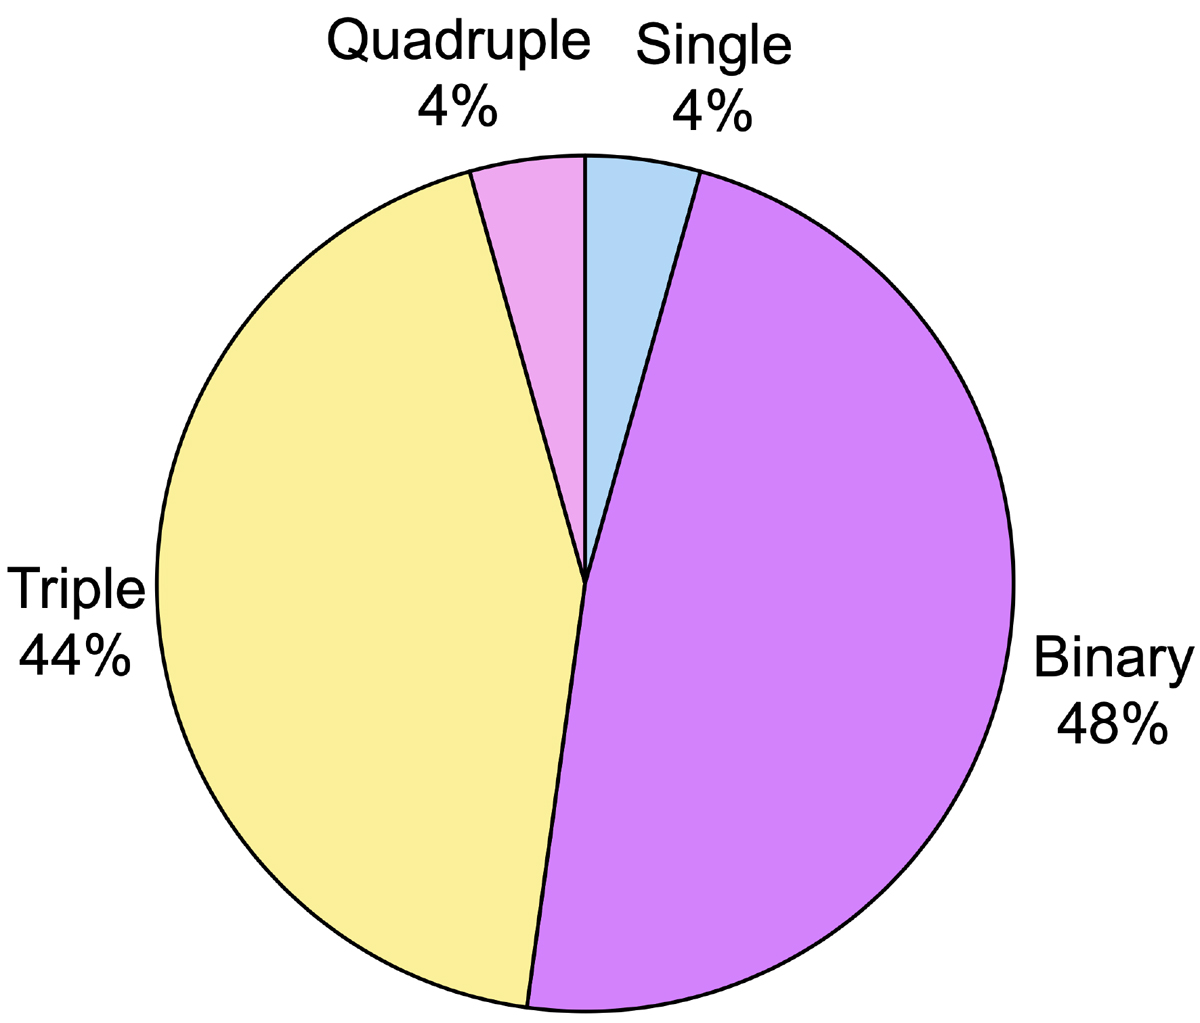
Fig. 10.
Download original image
Pie chart showing the multiplicity of our entire B star sample, taking into account spectroscopic, interferometric, and Gaia DR3 companions. This chart excludes stars for which the results in the literature are unclear for the presence of a spectroscopic companion or those that lack spectroscopic data for a search for such a companion, meaning that these percentages are calculated for a sub-sample of 23 sources and not for the total 32.
Current usage metrics show cumulative count of Article Views (full-text article views including HTML views, PDF and ePub downloads, according to the available data) and Abstracts Views on Vision4Press platform.
Data correspond to usage on the plateform after 2015. The current usage metrics is available 48-96 hours after online publication and is updated daily on week days.
Initial download of the metrics may take a while.