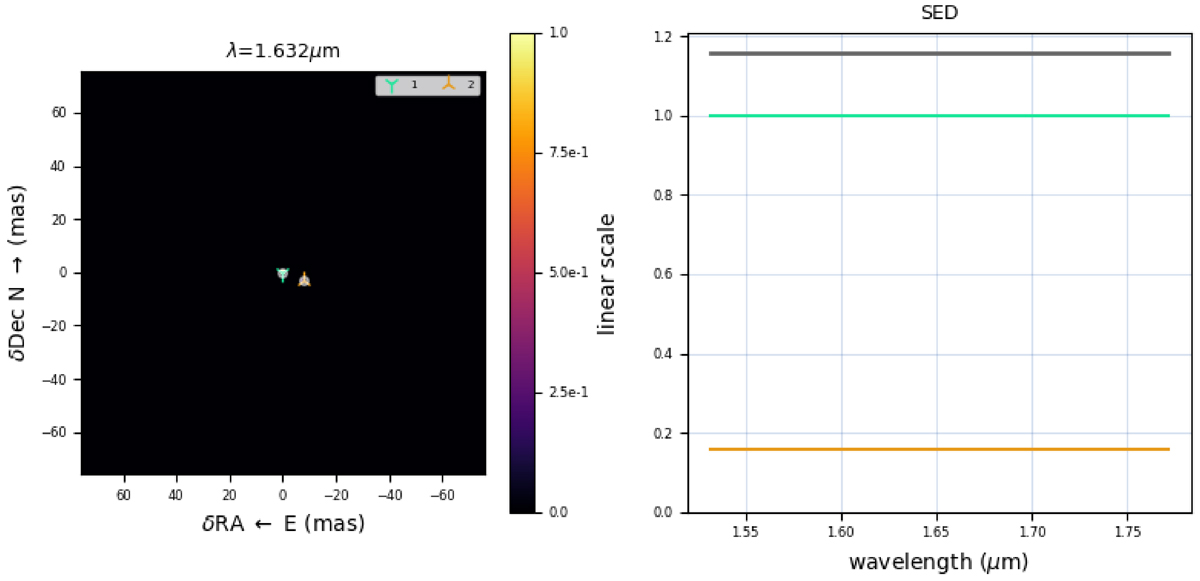
Fig. 2.
Download original image
Left: Model image created based on the best-fit model to the data shown in Figure 1, showing the primary (1) and secondary (2) stars needed in the model to reproduce the interferometric observables. The colour bar displays the arbitrary flux of the star. Right: The spectral energy distribution displaying the flux ratios of the stars in the model.
Current usage metrics show cumulative count of Article Views (full-text article views including HTML views, PDF and ePub downloads, according to the available data) and Abstracts Views on Vision4Press platform.
Data correspond to usage on the plateform after 2015. The current usage metrics is available 48-96 hours after online publication and is updated daily on week days.
Initial download of the metrics may take a while.