Fig. 4.
Download original image
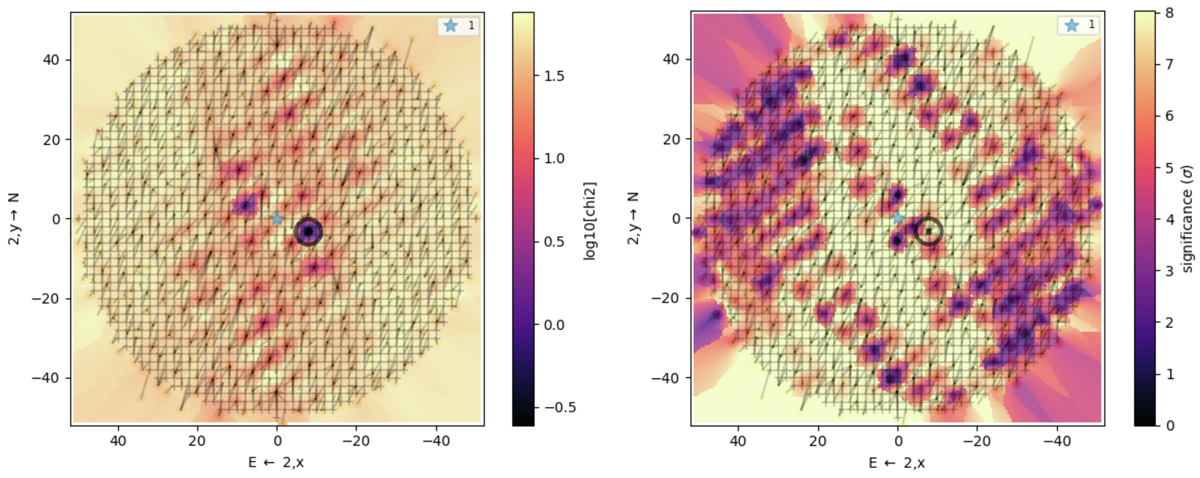
Example of a grid fit, in this case corresponding to Figure 1. On the left, we show the grid of potential companion positions that we searched in terms of goodness of fit, as quantified by the χ2. The primary star, which was fixed at position (0,0) during the fit, is shown by a blue star. The black circle shows the (x,y) position of the companion in the best-fitting model. On the right, we show the grid in terms of companion significance. This allowed us to determine whether a companion determined by the best-fitting model was significant in terms of its flux.
Current usage metrics show cumulative count of Article Views (full-text article views including HTML views, PDF and ePub downloads, according to the available data) and Abstracts Views on Vision4Press platform.
Data correspond to usage on the plateform after 2015. The current usage metrics is available 48-96 hours after online publication and is updated daily on week days.
Initial download of the metrics may take a while.