Fig. 6.
Download original image
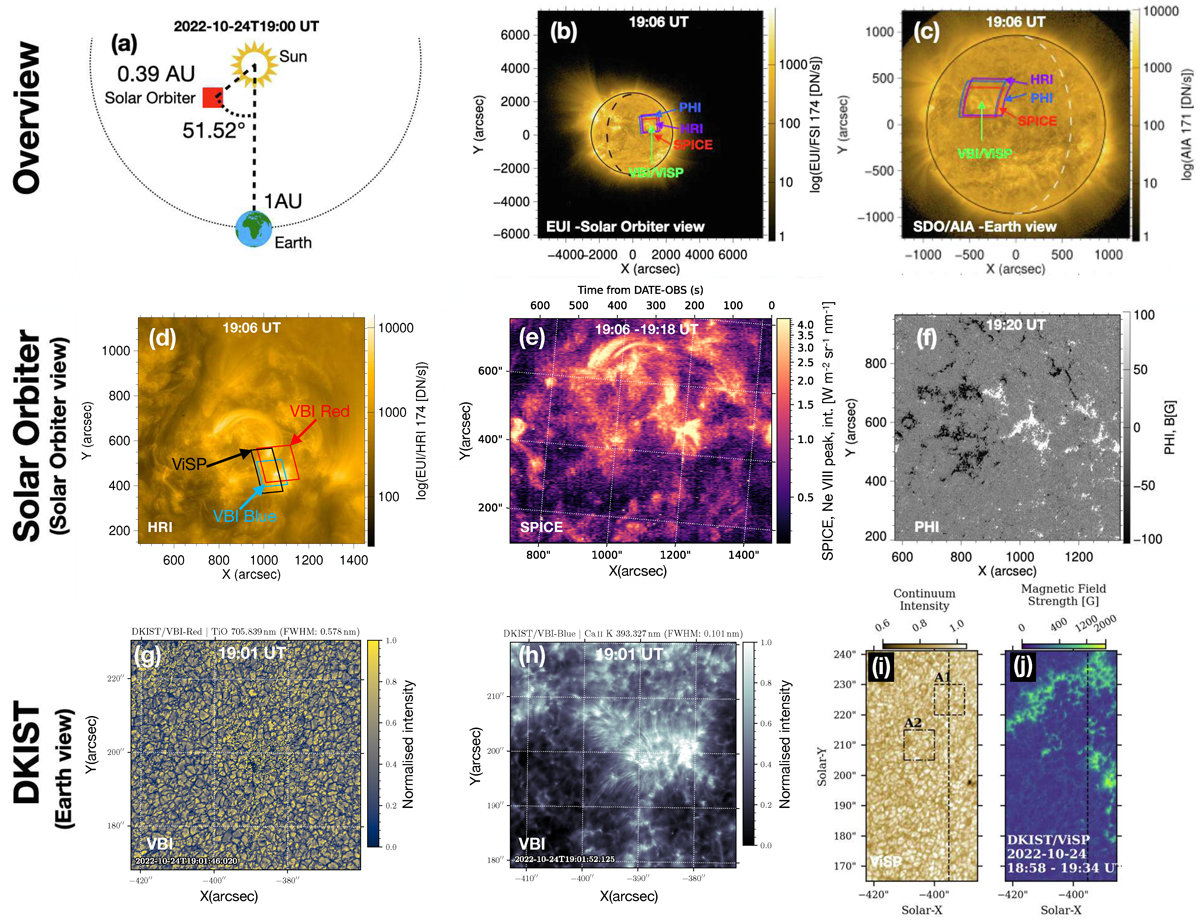
Overview of the coordinated observations provided by Solar Orbiter and DKIST on 24 October 2022. (a) Position of the Solar Orbiter spacecraft with respect to the Earth. (b) Sun as observed from the vantage point of Solar Orbiter. The coloured boxes again outline the fields of view of the coordinating instruments. (c) Sun observed with SDO/AIA, the same view as from DKIST, with the fields of view of the Solar Orbiter instruments overlaid. (d) HRI image showing the coronal emission with a high-resolution. The overlaid boxes outline the fields of view of the DKIST instruments: Red is for the VBI-Red FOV, blue is for the VBI-Blue FOV, and black is for the ViSP raster FOV. (e) SPICE raster map showing the transition region emission peak intensity of the Ne VIII spectral line. (f) PHI magnetograms showing the magnetic field in range between -100 and 100 G. (g) DKIST VBI-Red band image showing the photospheric granulation in the TiO spectral line. (h) DKIST VBI-Blue band image showing the chromosphere in CaII K spectral line. (i) DKIST ViSP data showing the photospheric granulation observed in continuum. (j) Corresponding absolute magnetic field strength.
Current usage metrics show cumulative count of Article Views (full-text article views including HTML views, PDF and ePub downloads, according to the available data) and Abstracts Views on Vision4Press platform.
Data correspond to usage on the plateform after 2015. The current usage metrics is available 48-96 hours after online publication and is updated daily on week days.
Initial download of the metrics may take a while.