Fig. 7.
Download original image
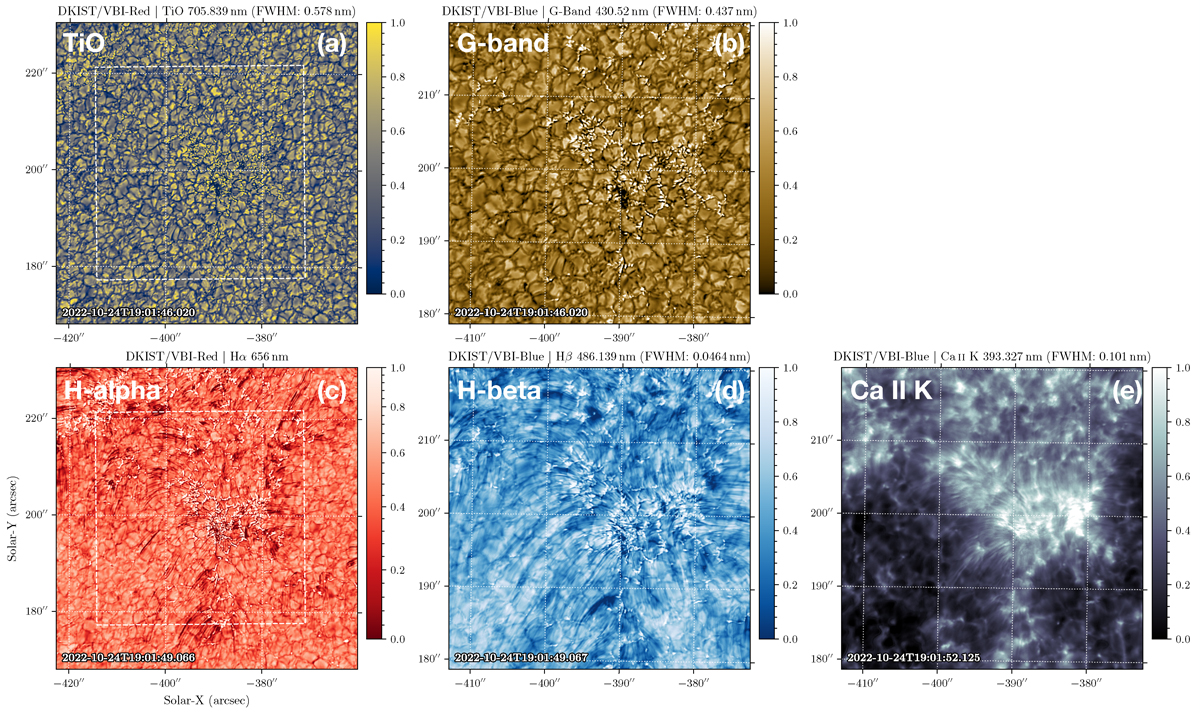
Overview of the VBI observations (both blue and red) obtained by DKIST on 24 October 2022. The top row shows a plot of the solar atmosphere observed using the photospheric TiO (a; VBI-red) and G-band (b; VBI-blue) filters. The bottom row shows a plot of the solar atmosphere observed using the chromospheric H-alpha (c; VBI-red), H-beta (d; VBI-blue), and Ca II k (e; VBI-blue) filters. The H-alpha filter was found to be off-band for that period, and this is why the chromospheric features are more visible in H-beta than in H-alpha. The white dash line presented in the VBI-Red images (a,c) highlights the VBI-Blue.
Current usage metrics show cumulative count of Article Views (full-text article views including HTML views, PDF and ePub downloads, according to the available data) and Abstracts Views on Vision4Press platform.
Data correspond to usage on the plateform after 2015. The current usage metrics is available 48-96 hours after online publication and is updated daily on week days.
Initial download of the metrics may take a while.