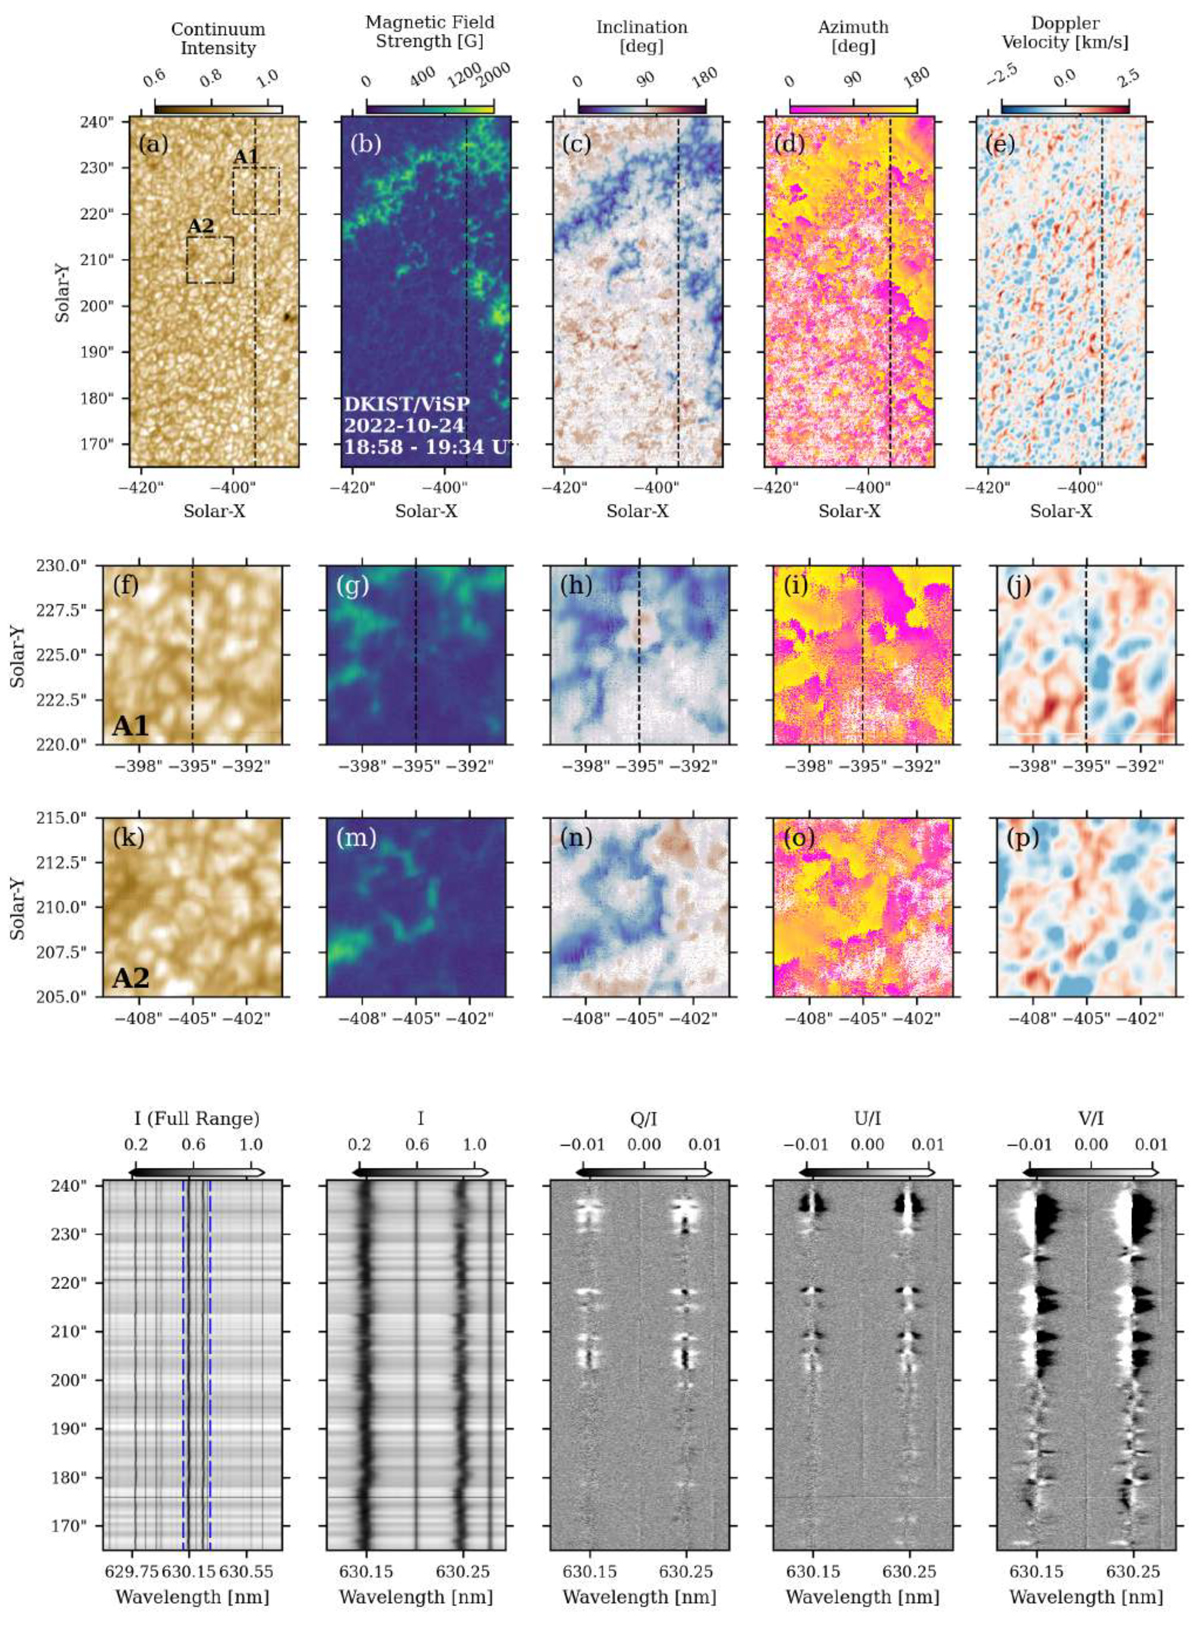
Fig. A.1.
Download original image
DKIST/ViSP spectropolarimetric data were acquired in the Fe I 6300 Å bandpass on 24 October 2022 between 18:58 and 19:34 UT. The upper panels present results from Milne-Eddington inversions that yield the magnetic field vector. Panel (a) displays the photospheric granulation observed in continuum intensity. The corresponding vector magnetogram components highlight the magnetic field strength, which reaches values of up to 2 kG in panel (b), as well as the magnetic field inclination (c) and azimuth (d). The photospheric Doppler velocity is shown in panel (e), ranging from ± 2.5 km/s. To further illustrate granular details, two selected regions, A1 and A2, are examined closely. The continuum intensity map, along with magnetic field strength, vector inclination, vector azimuth, and photospheric Doppler velocities for region A1 are shown in panels (f, g, h, i, j), while the corresponding data for region A2 are presented in panels (k, m, n, o, p). The Stokes vectors in the lower panel are extracted from the dashed vertical lines in the upper panels, providing additional insights into the data analysis.
Current usage metrics show cumulative count of Article Views (full-text article views including HTML views, PDF and ePub downloads, according to the available data) and Abstracts Views on Vision4Press platform.
Data correspond to usage on the plateform after 2015. The current usage metrics is available 48-96 hours after online publication and is updated daily on week days.
Initial download of the metrics may take a while.