Fig. 11.
Download original image
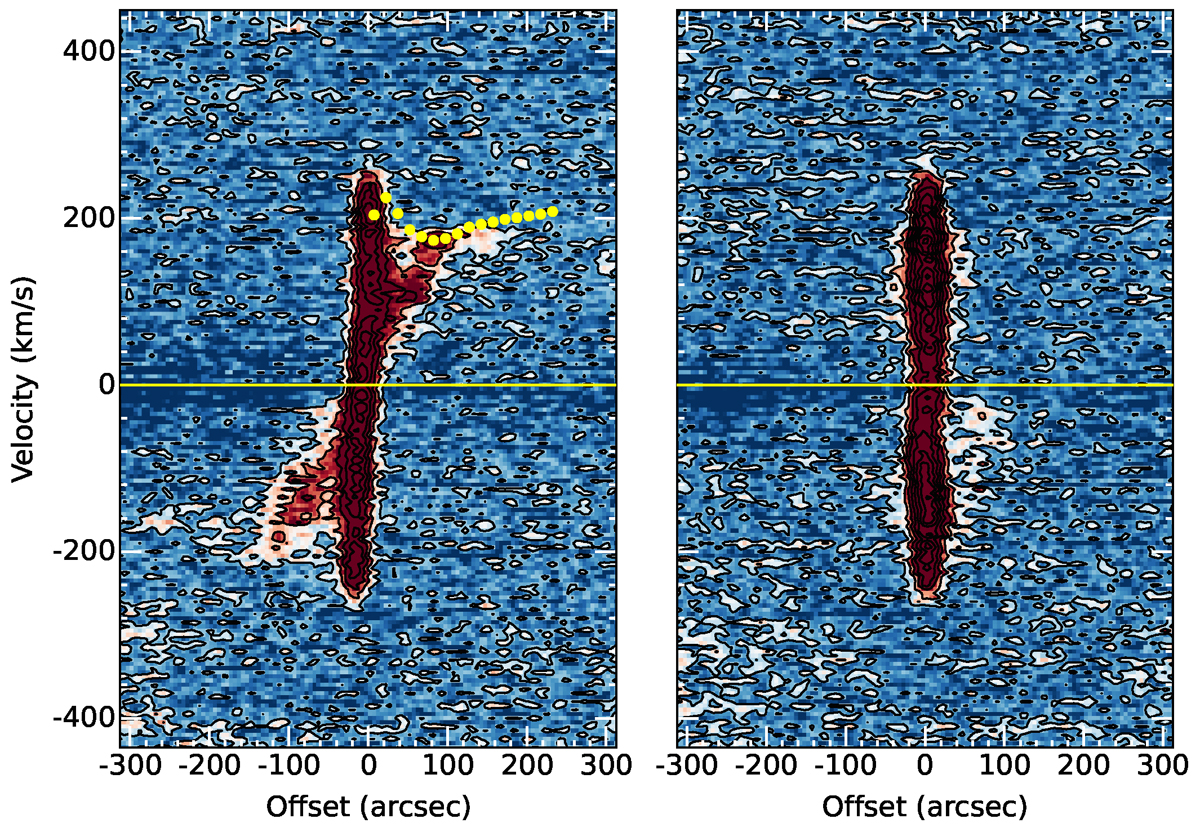
Position-velocity diagrams extracted along the major (left) and minor (right) axes of NGC 1097. Slices were taken along paths of length 11′, and a width of 4′ in order to include all the large-scale emission. The major axis slice was aligned at 137°, and the minor slice at 47°. The yellow circles mark the projected rotational velocities used in the 3DBAROLO modeling. Contours in black range from 1 to 100 × σ in steps of 3σ, where σ is 1.8 mJy/pixel. The yellow line marks the systemic velocity of NGC 1097 at 1258 km/s.
Current usage metrics show cumulative count of Article Views (full-text article views including HTML views, PDF and ePub downloads, according to the available data) and Abstracts Views on Vision4Press platform.
Data correspond to usage on the plateform after 2015. The current usage metrics is available 48-96 hours after online publication and is updated daily on week days.
Initial download of the metrics may take a while.