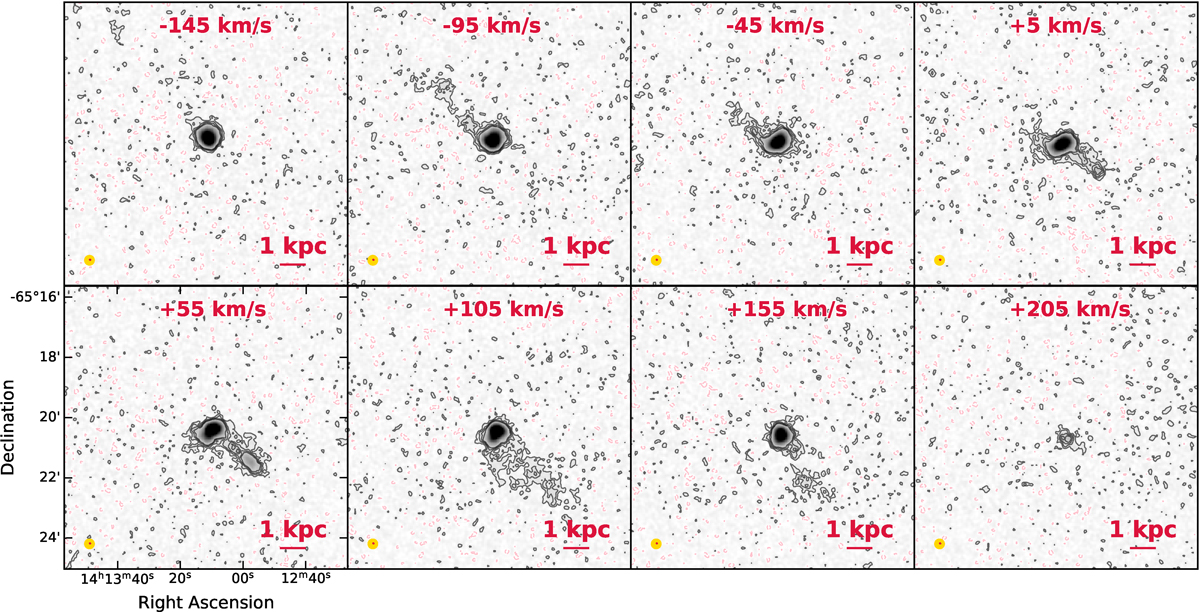
Fig. B.1.
Download original image
Channel maps of the CO(3–2) emission in the Circinus galaxy, integrated over 10 channels (50 km/s). The channel maps are produced from the unmasked data. Contours: The black contours show CO(3–2) emission contours in each channel at 2, 4, 6, 8 × σ, where σ was calculated as the rms of the pixels in a circular annulus (rin = 225″, rout = 285″) excluding line emission from the galaxy in the center and noisy pixels toward the edges of the map. The pink contours show negative emission at a 2σ level. The channels from +55 to +155 km/s show clumps of increased emission located about 1.8 kpc from the center. The beam sizes of the APEX (yellow) data are shown in the bottom left, and the bottom right scale bar marks a projected distance of 1 kpc.
Current usage metrics show cumulative count of Article Views (full-text article views including HTML views, PDF and ePub downloads, according to the available data) and Abstracts Views on Vision4Press platform.
Data correspond to usage on the plateform after 2015. The current usage metrics is available 48-96 hours after online publication and is updated daily on week days.
Initial download of the metrics may take a while.