Fig. 2.
Download original image
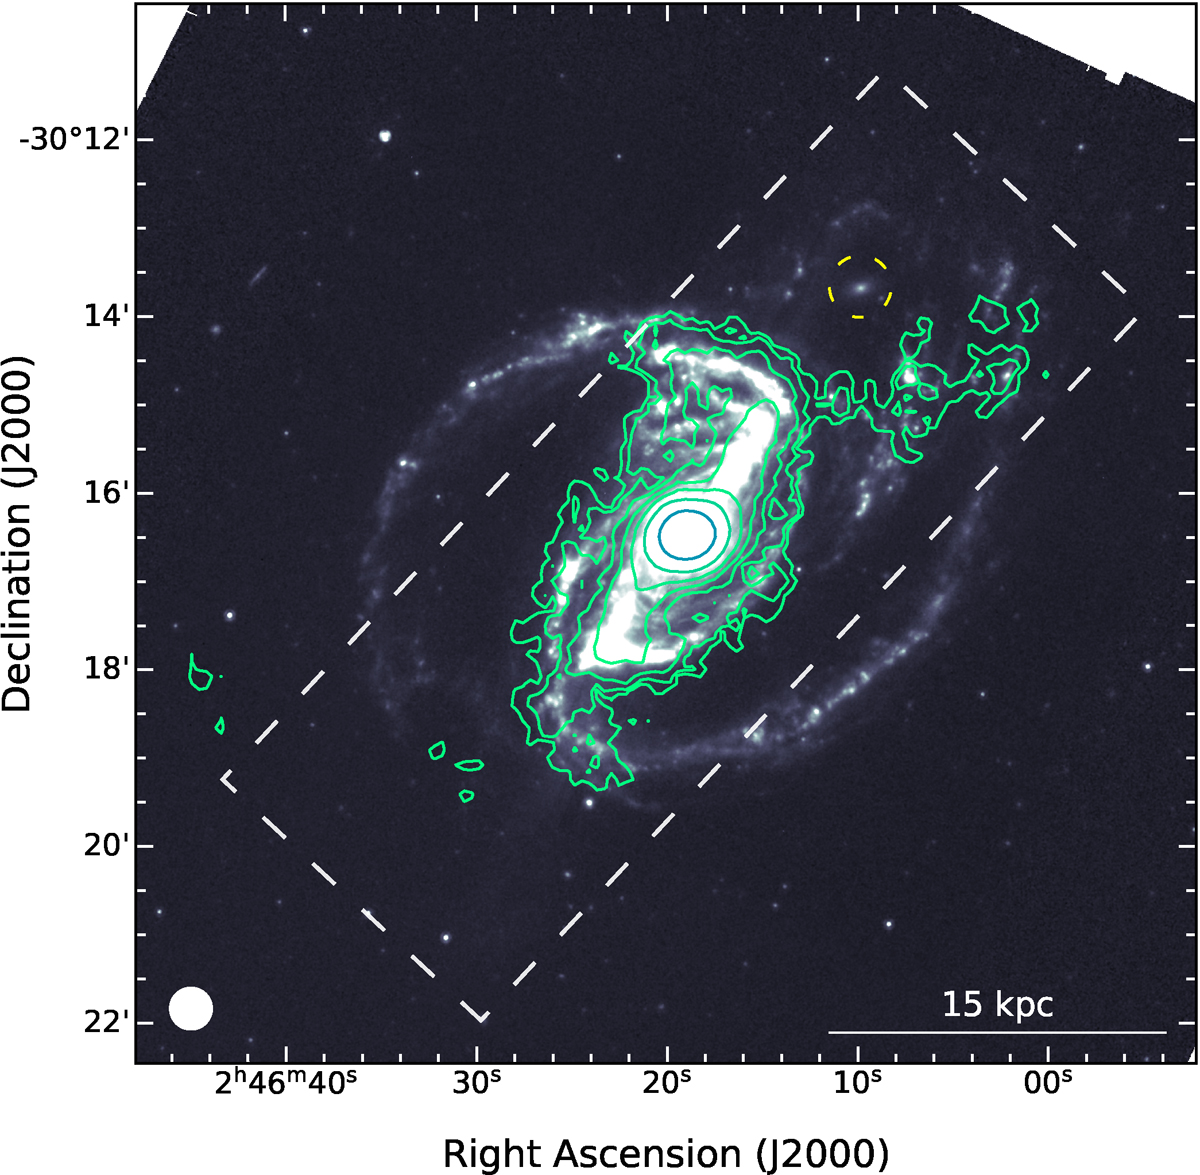
CO(2–1) integrated intensity contours calculated from –485 to 500 km/s using the dilated masking technique for NGC 1097 overplotted on the Spitzer/IRAC 8 μm continuum map. The contours are plotted on 8 log-spaced intervals, ranging from 0.15 Jy km/s to 75.6 Jy km/s. The dashed yellow circle marks the position of the companion galaxy NGC 1097A. The dashed box shows the slice used for the major axis position-velocity cut. The beam size of the APEX observations (28![]() 7) is shown in the bottom left.
7) is shown in the bottom left.
Current usage metrics show cumulative count of Article Views (full-text article views including HTML views, PDF and ePub downloads, according to the available data) and Abstracts Views on Vision4Press platform.
Data correspond to usage on the plateform after 2015. The current usage metrics is available 48-96 hours after online publication and is updated daily on week days.
Initial download of the metrics may take a while.