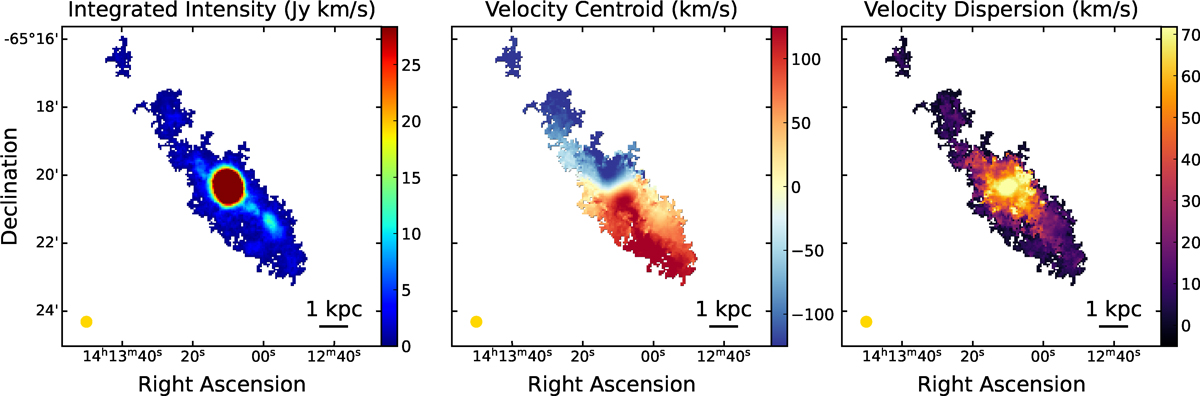
Fig. 5.
Download original image
Moment maps of Circinus. From left to right: Integrated intensity, velocity centroid, and velocity dispersion (moment 0, 1, 2) maps, obtained by integrating over the data cube after applying the dilated masking procedure, from –370 to 500 km/s. The color scale of the integrated intensity map is kept relatively flat to showcase lower intensity extended structures. The size of the APEX beam is displayed on the bottom left of the panels.
Current usage metrics show cumulative count of Article Views (full-text article views including HTML views, PDF and ePub downloads, according to the available data) and Abstracts Views on Vision4Press platform.
Data correspond to usage on the plateform after 2015. The current usage metrics is available 48-96 hours after online publication and is updated daily on week days.
Initial download of the metrics may take a while.