Fig. 8.
Download original image
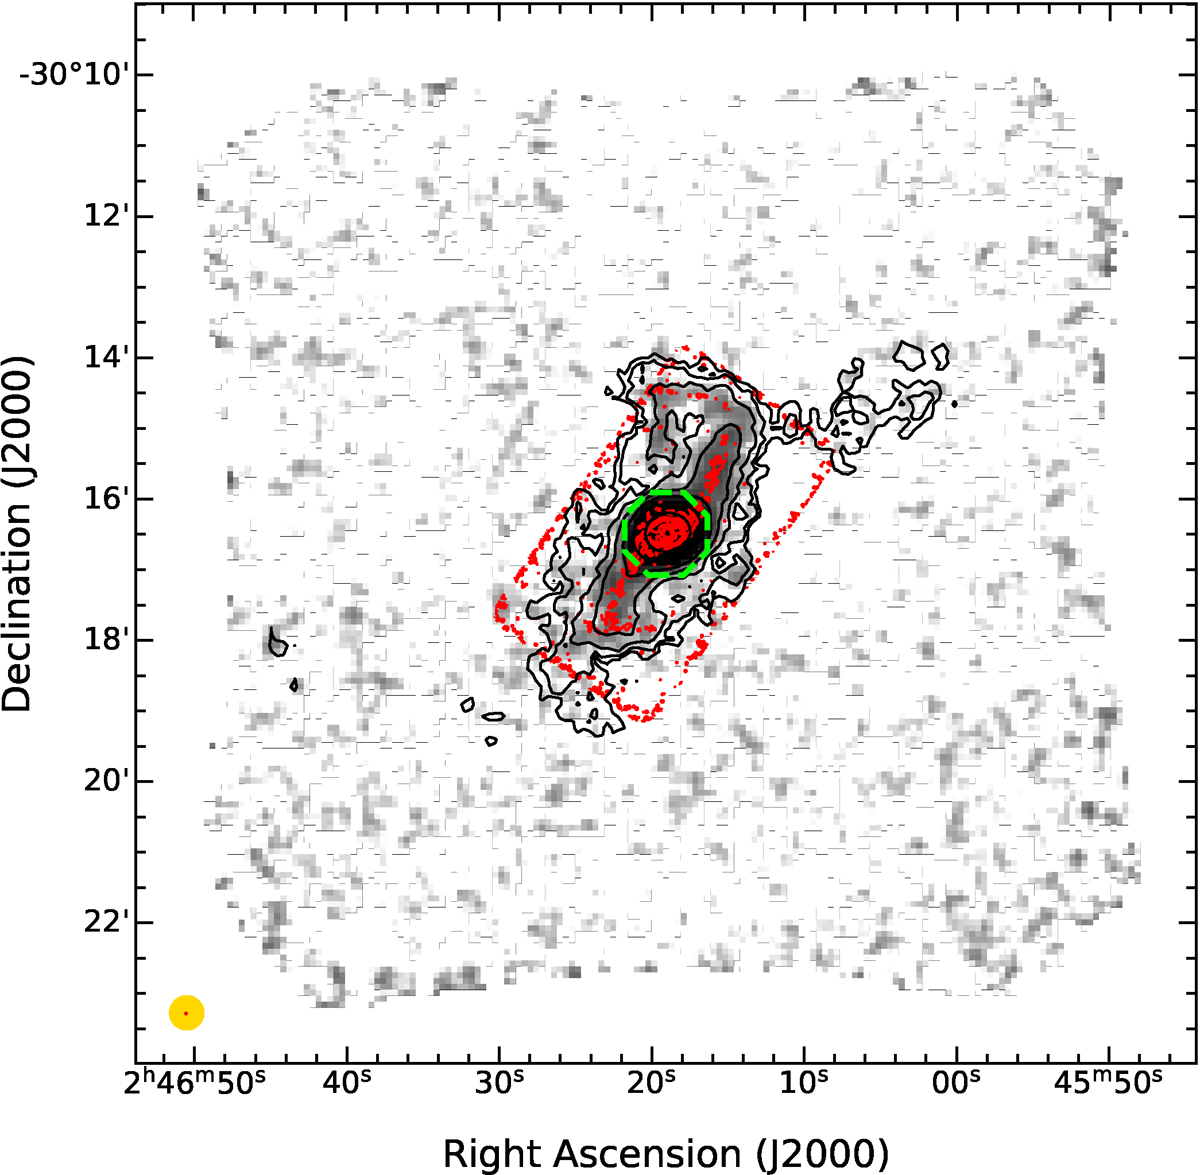
CO(2–1) integrated intensity map computed from the unmasked data from –285 to 410 km/s for NGC 1097. The APEX contours are plotted from the masked integrated intensity map in 8 log-spaced levels from 0.15 Jy km/s to 75.6 Jy km/s. The red contours show the integrated intensity map of the ALMA CO(2–1) data from Leroy et al. (2021a). The 4 contours are plotted on log-spaced intervals, starting at 1.9 Jy/beam km/s to 24.7 Jy/beam km/s. The dashed green circle marks the 35″ (2.3 kpc) radius aperture around the starburst ring. The beam size of the APEX and ALMA observations is shown in the bottom left.
Current usage metrics show cumulative count of Article Views (full-text article views including HTML views, PDF and ePub downloads, according to the available data) and Abstracts Views on Vision4Press platform.
Data correspond to usage on the plateform after 2015. The current usage metrics is available 48-96 hours after online publication and is updated daily on week days.
Initial download of the metrics may take a while.