Fig. 5.
Download original image
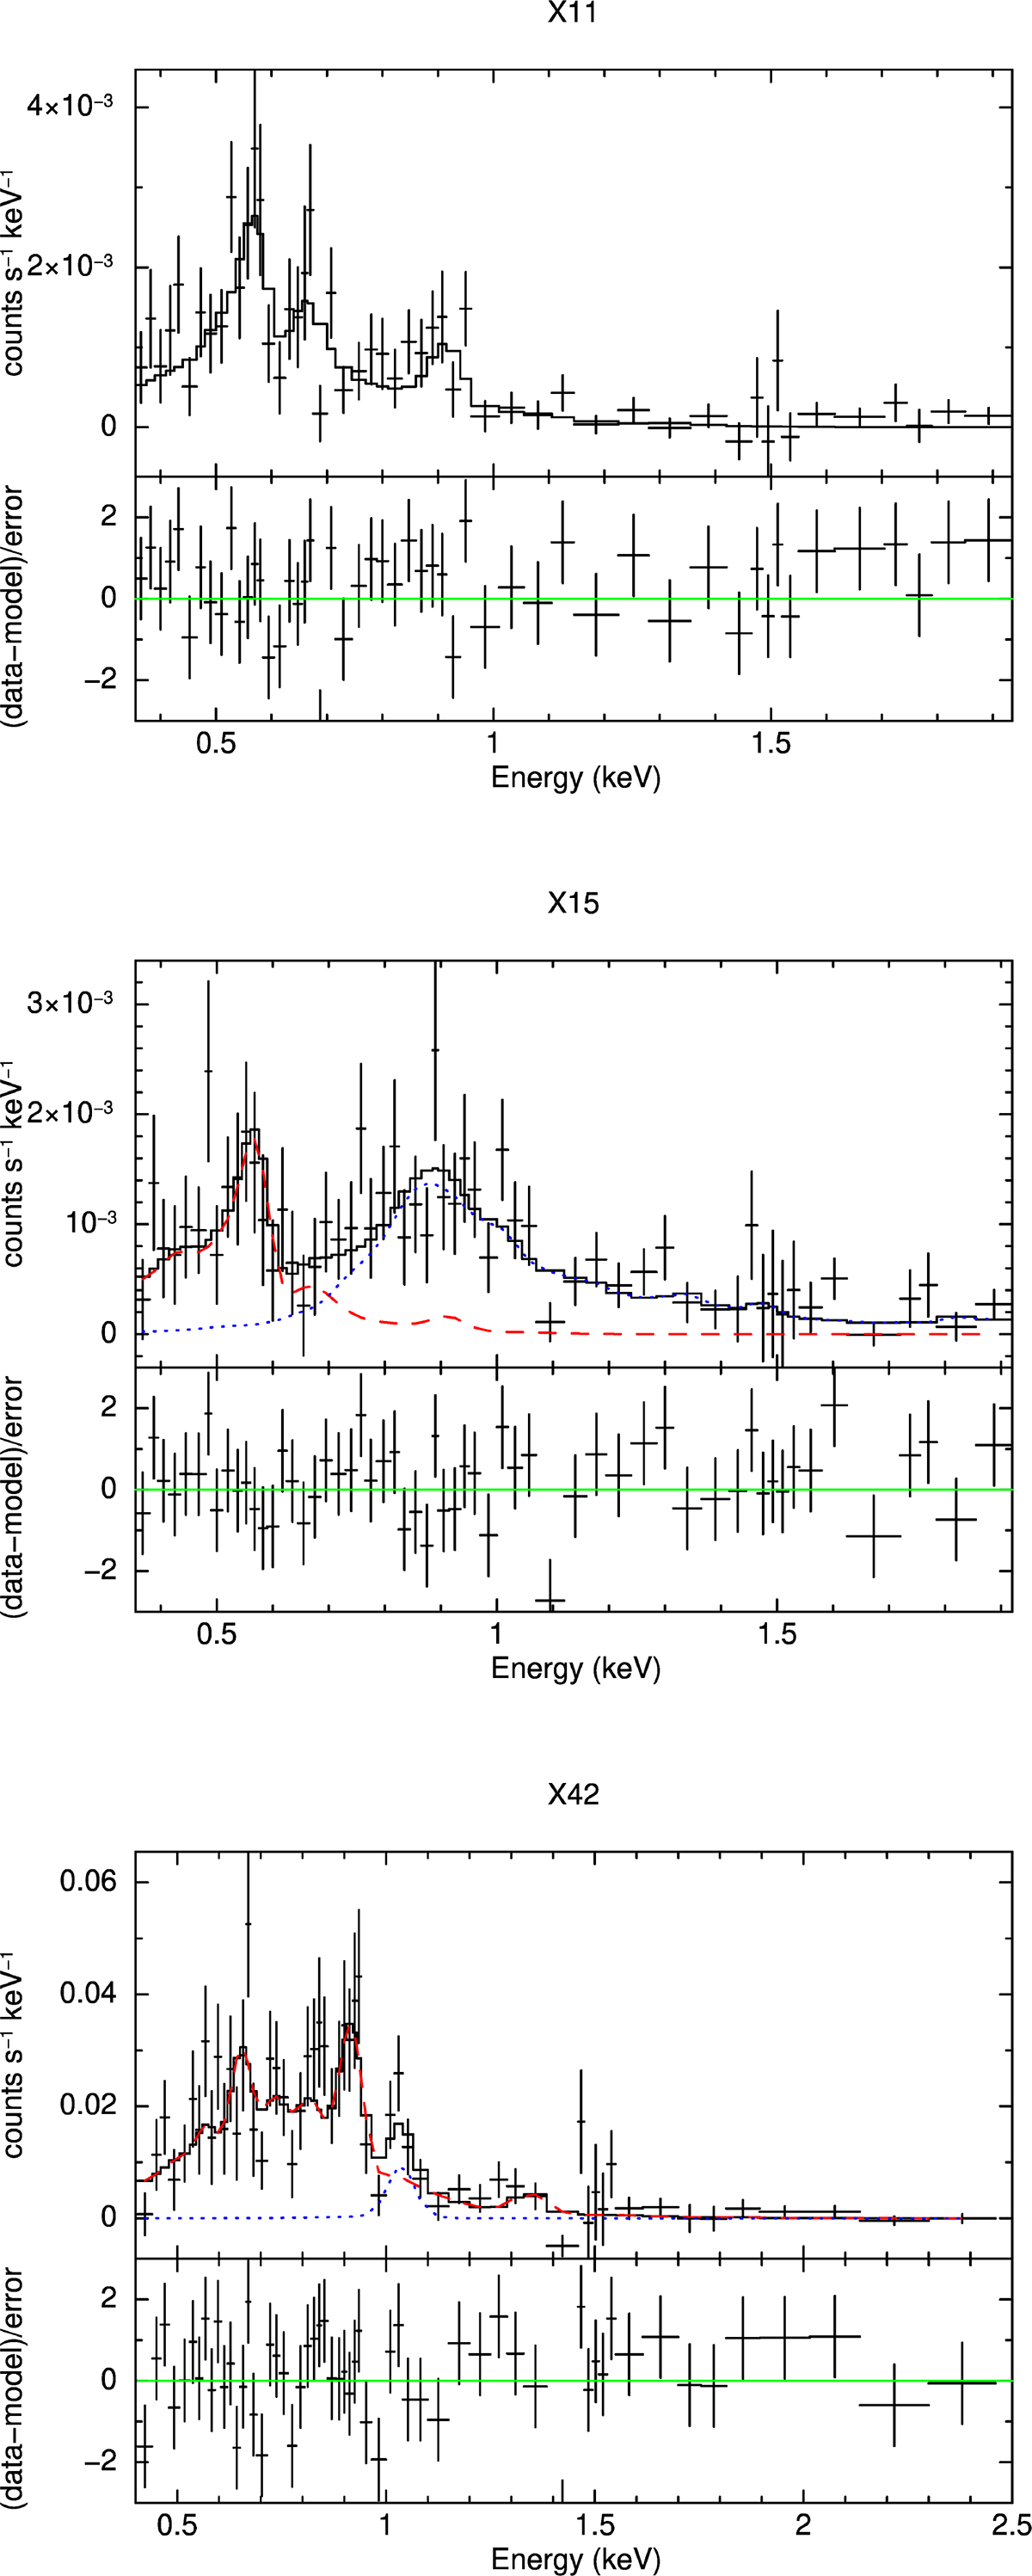
Combined EPIC MOS spectra and best-fit models for sources X11, X15, and X42. The spectra of X11 and X42 are fitted with one temperature thermal-plasma model. The spectrum of X15 is fitted with two temperature thermal-plasma components shown with red dashed and blue dotted lines. The fit residuals for all sources are displayed in the bottom panels of each plot, with error bars representing 1σ uncertainties.
Current usage metrics show cumulative count of Article Views (full-text article views including HTML views, PDF and ePub downloads, according to the available data) and Abstracts Views on Vision4Press platform.
Data correspond to usage on the plateform after 2015. The current usage metrics is available 48-96 hours after online publication and is updated daily on week days.
Initial download of the metrics may take a while.