Fig. 3
Download original image
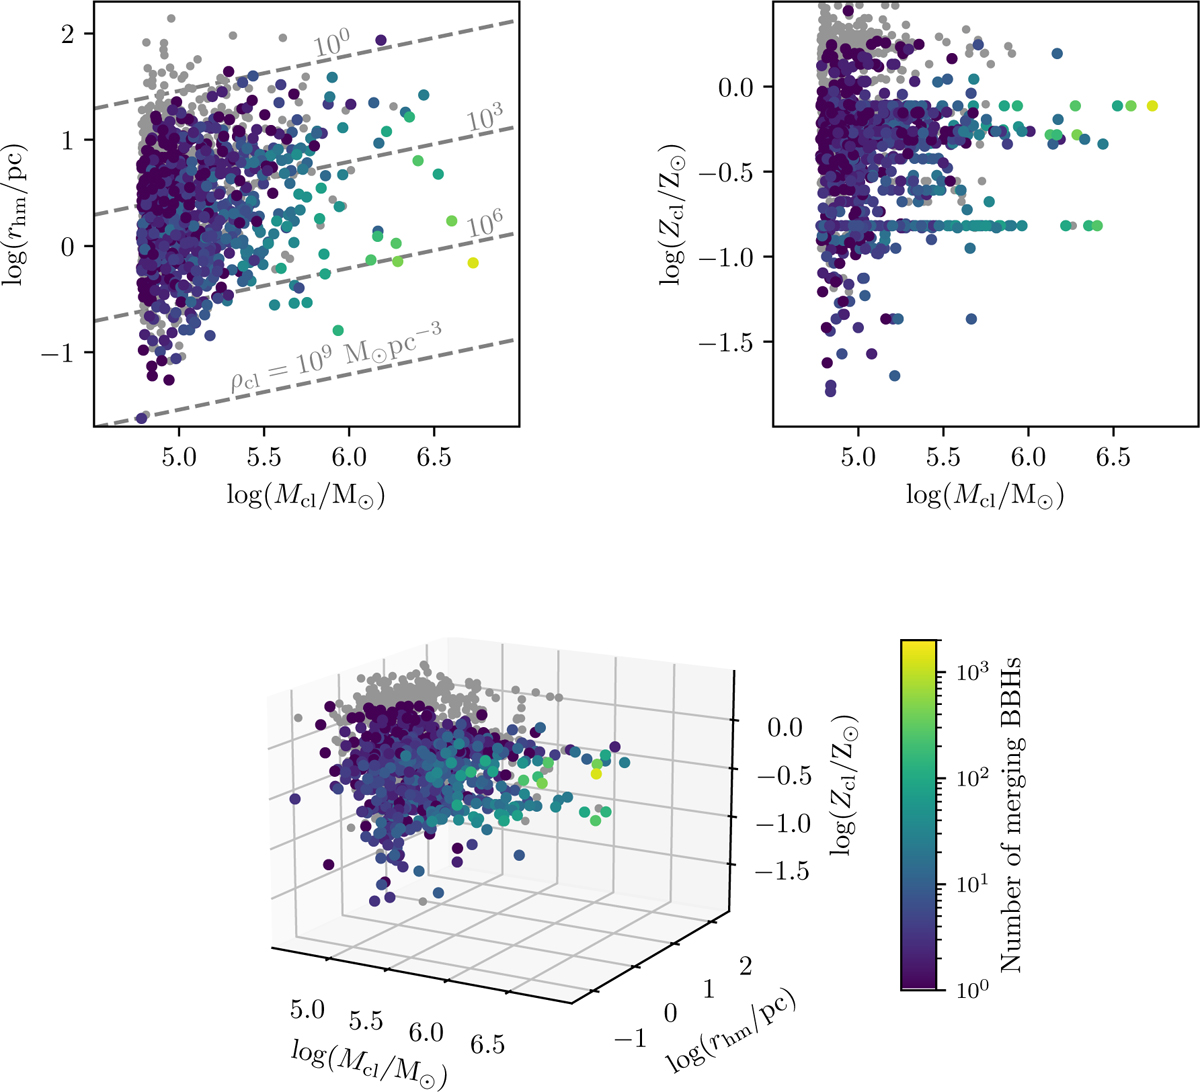
Upper left panel: 2D projection on the plane (Mcl, rhm) of the 1500 clusters integrated with CMC. Clusters in which no merging BBH are formed are indicated as grey dots, while the coloured dots represent the number of merging BBHs formed in each cluster. The diagonal dashed grey lines represent lines of constant density ![]() . Upper right panel: 2D projection on the plane (Mcl, Zcl). Colours indicate the number of merging BBHs with the same norm as in the left-hand panel. Lower panel: 3D grid in parameter space (Mcl, rhm, Zcl).
. Upper right panel: 2D projection on the plane (Mcl, Zcl). Colours indicate the number of merging BBHs with the same norm as in the left-hand panel. Lower panel: 3D grid in parameter space (Mcl, rhm, Zcl).
Current usage metrics show cumulative count of Article Views (full-text article views including HTML views, PDF and ePub downloads, according to the available data) and Abstracts Views on Vision4Press platform.
Data correspond to usage on the plateform after 2015. The current usage metrics is available 48-96 hours after online publication and is updated daily on week days.
Initial download of the metrics may take a while.