Fig. 1
Download original image
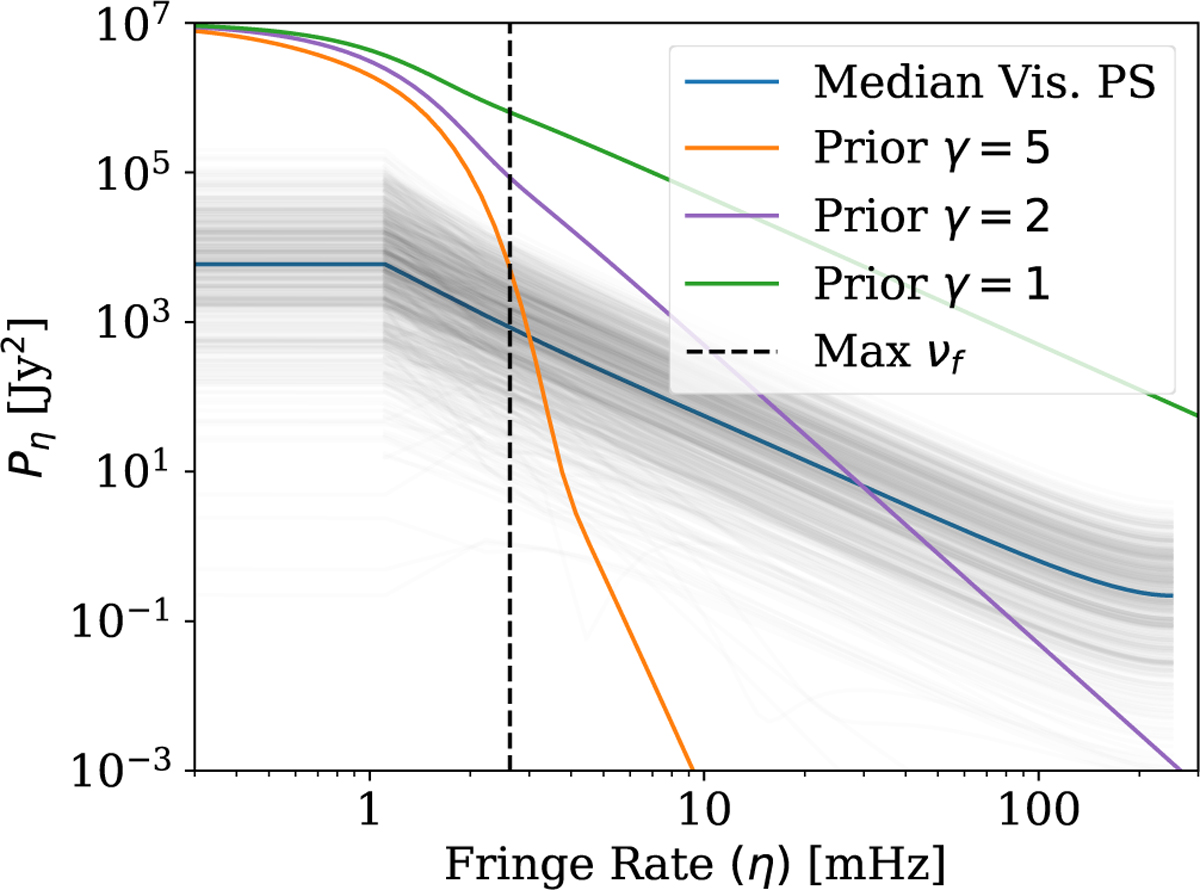
Power spectrum prior used for our astronomical visibilities (orange). The faint black curves are the true calculated power spectrum for all baselines in one of our simulations. The blue curve shows the median power spectrum and the black dashed line shows the maximum expected fringe rate of the longest baseline in our simulation. The parameters for the example priors shown are P0 = 107 Jy2, η0 = 1 mHz. and γ = 5, 2, and 1.
Current usage metrics show cumulative count of Article Views (full-text article views including HTML views, PDF and ePub downloads, according to the available data) and Abstracts Views on Vision4Press platform.
Data correspond to usage on the plateform after 2015. The current usage metrics is available 48-96 hours after online publication and is updated daily on week days.
Initial download of the metrics may take a while.