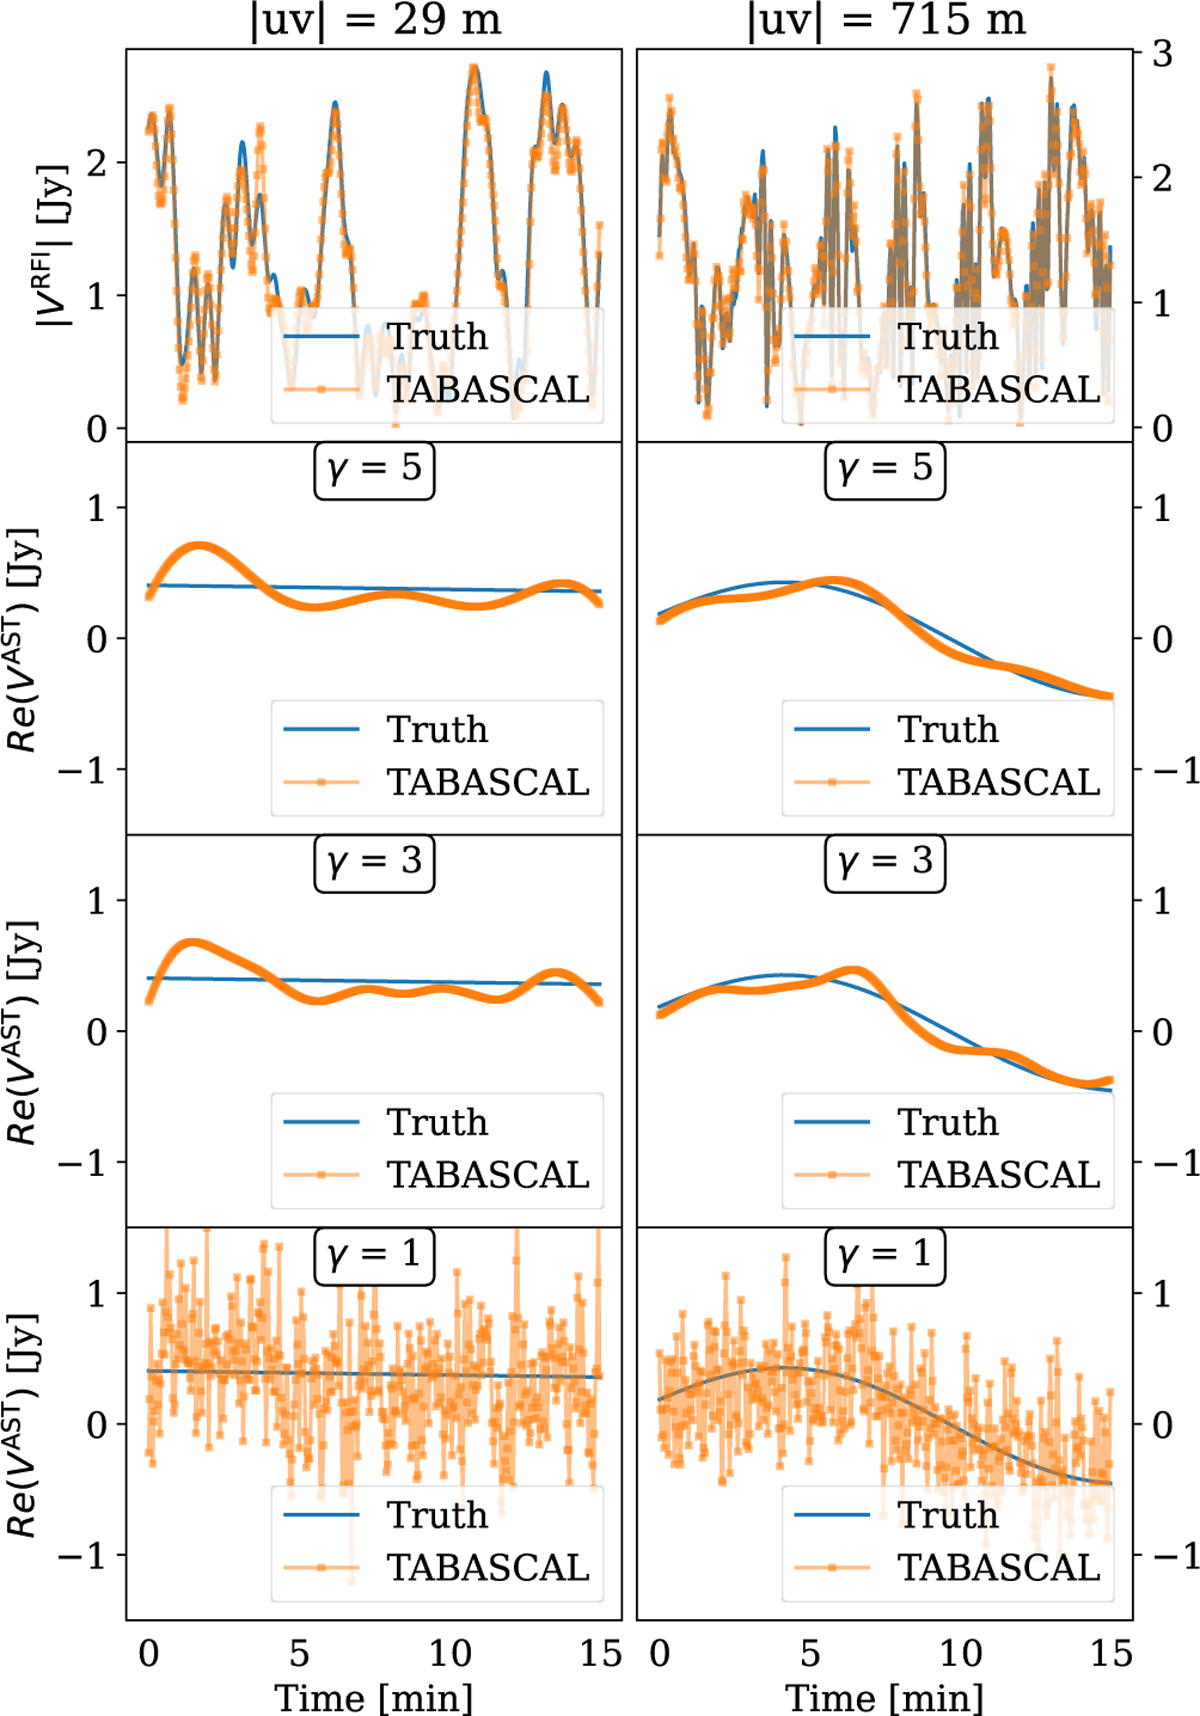
Fig. 3
Download original image
Example predictions from TABASCAL for two different baselines (left and right) on an observation containing six satellites. The orange dotted curve shows the TABASCAL prediction and the blue curve shows the true value. The top panel shows this for the RFI visibility magnitude and the lower panels show the real part of the astronomical visibility. The top panel corresponds to a TABASCAL run where γ = 5, as defined in Equation (10). The three lower panels show the results when varying the prior parameter γ for the astronomical visibilities. Finally, γ controls the smoothness of the solutions.
Current usage metrics show cumulative count of Article Views (full-text article views including HTML views, PDF and ePub downloads, according to the available data) and Abstracts Views on Vision4Press platform.
Data correspond to usage on the plateform after 2015. The current usage metrics is available 48-96 hours after online publication and is updated daily on week days.
Initial download of the metrics may take a while.