Fig. 4
Download original image
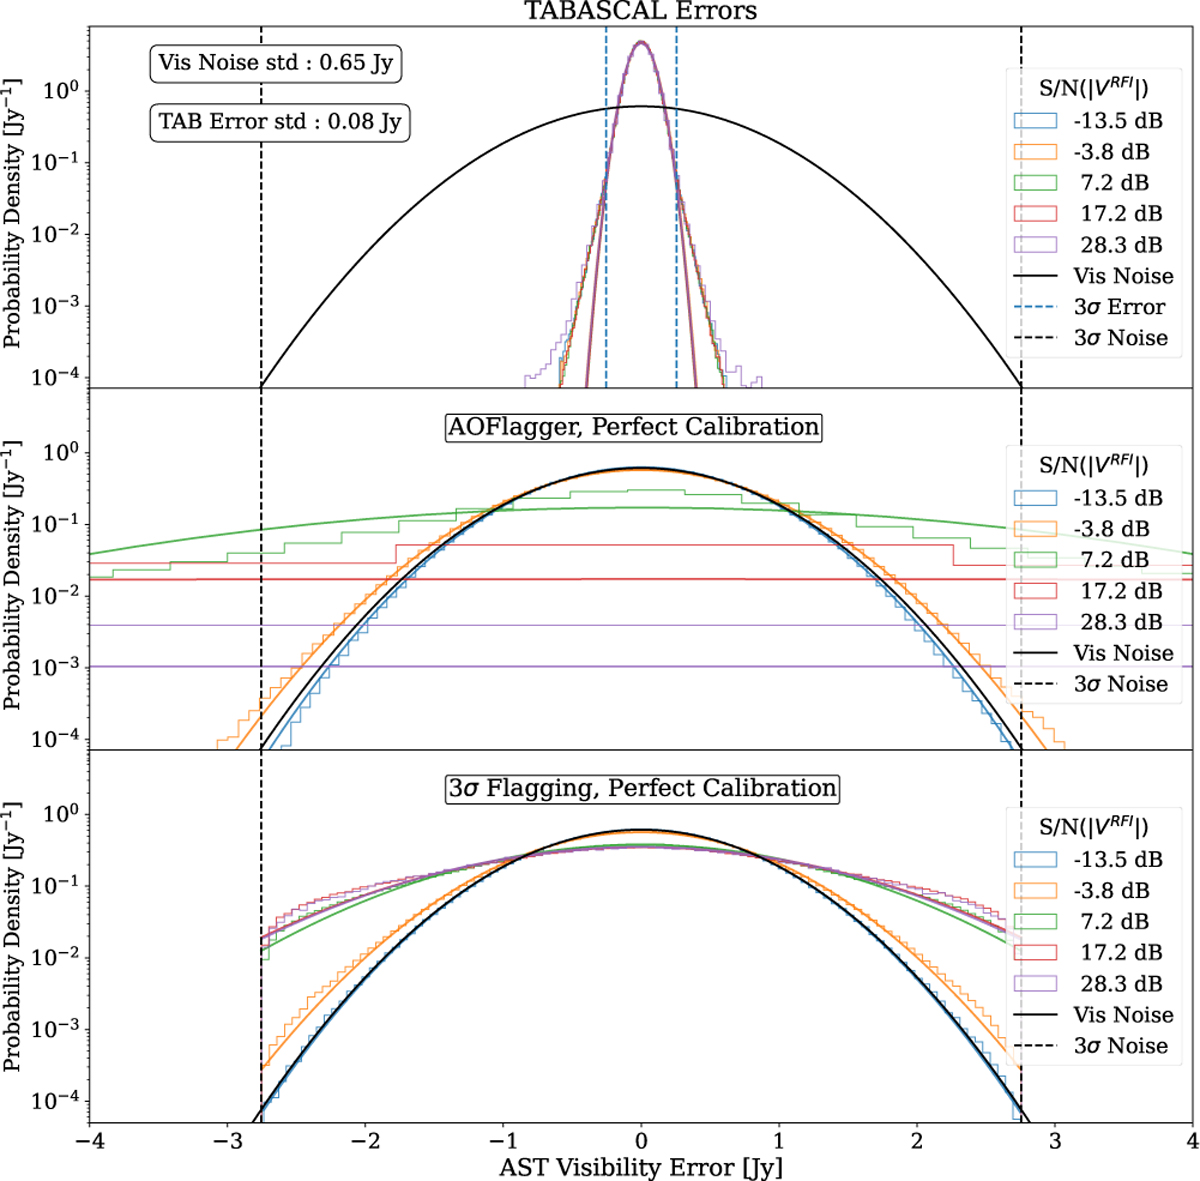
Errors in the astronomical visibility predictions from TABAS-CAL and the other cases for comparison as the S/N of the RFI is varied. The black curve shows the distribution of the visibility noise used in the observations and therefore corresponds to the errors in the uncontaminated case. In each panel five bins of RFI strength are used where multiple observations are bundled together. The coloured curves show the Gaussian fit to the error distributions, (i) The top panel shows the errors in the TABASCAL predicted visibilities, (ii) The middle and bottom panels show the errors from the AOFLAGGER and perfect 3σ flagging cases where flagged data is not included in the histograms.
Current usage metrics show cumulative count of Article Views (full-text article views including HTML views, PDF and ePub downloads, according to the available data) and Abstracts Views on Vision4Press platform.
Data correspond to usage on the plateform after 2015. The current usage metrics is available 48-96 hours after online publication and is updated daily on week days.
Initial download of the metrics may take a while.