Fig. 6
Download original image
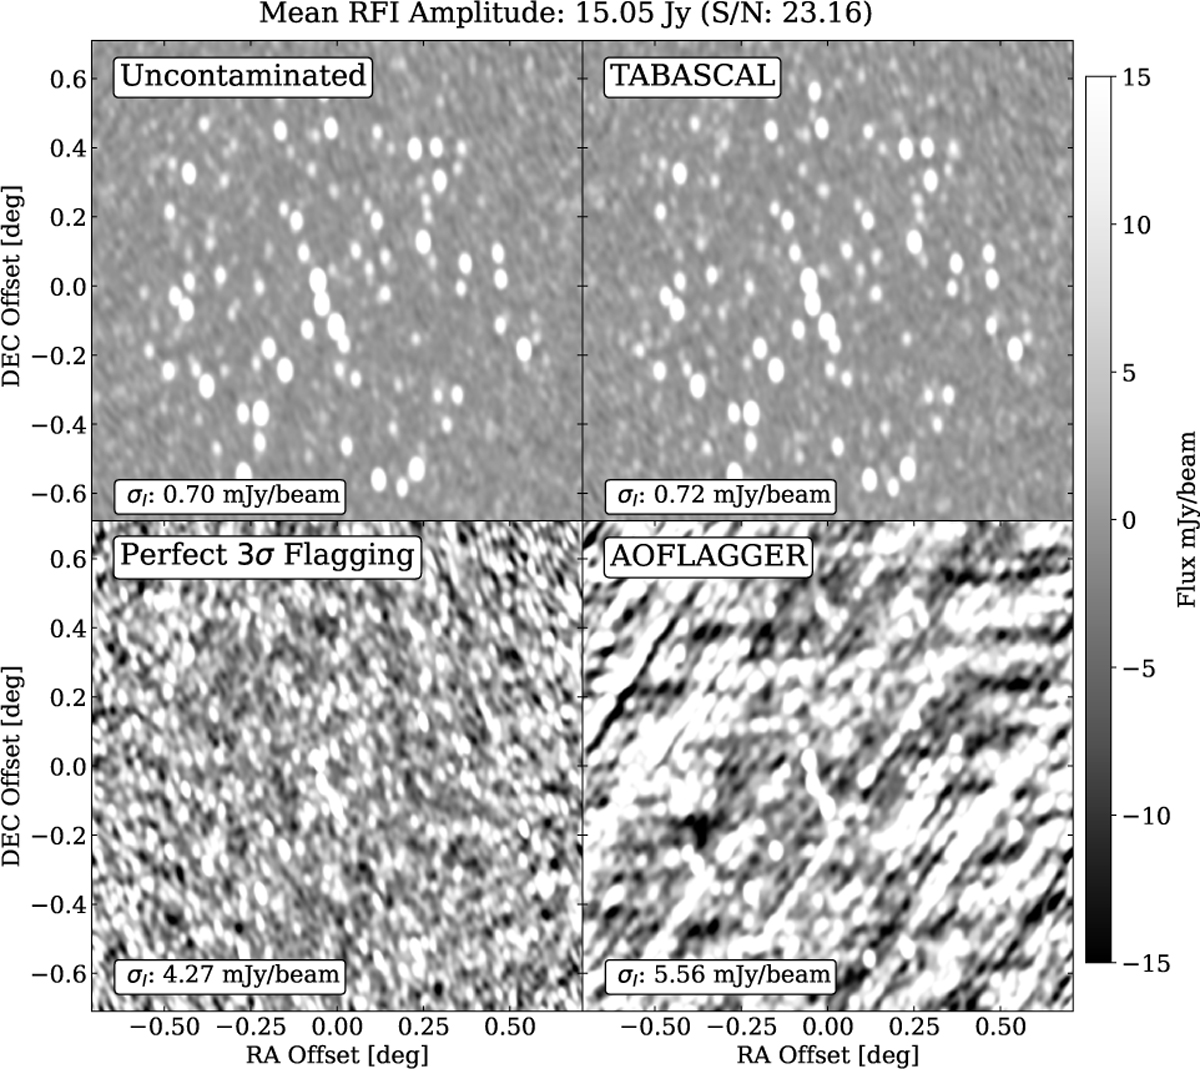
Images constructed from the same observation with our four different cases. Top left: no RFI contamination. Top right: TABASCAL fully removes the RFI and recovers the astronomical signal with comparable image noise to the uncontaminated data. Bottom-left and right: the images from perfect 3σ flagging and AOFLAGGER respectively showing significantly higher image noise of 6× and 8× respectively. The AOFLAGGER image shows significant striped image artefacts which largely invalidates its use for science, with purity and completeness of around 20% and 50% respectively (see Figures 9 and 8). The mean RFI S/N in this data was 23. For large RFI amplitudes the quality differences between TABASCAL and the flagging methods increases further.
Current usage metrics show cumulative count of Article Views (full-text article views including HTML views, PDF and ePub downloads, according to the available data) and Abstracts Views on Vision4Press platform.
Data correspond to usage on the plateform after 2015. The current usage metrics is available 48-96 hours after online publication and is updated daily on week days.
Initial download of the metrics may take a while.