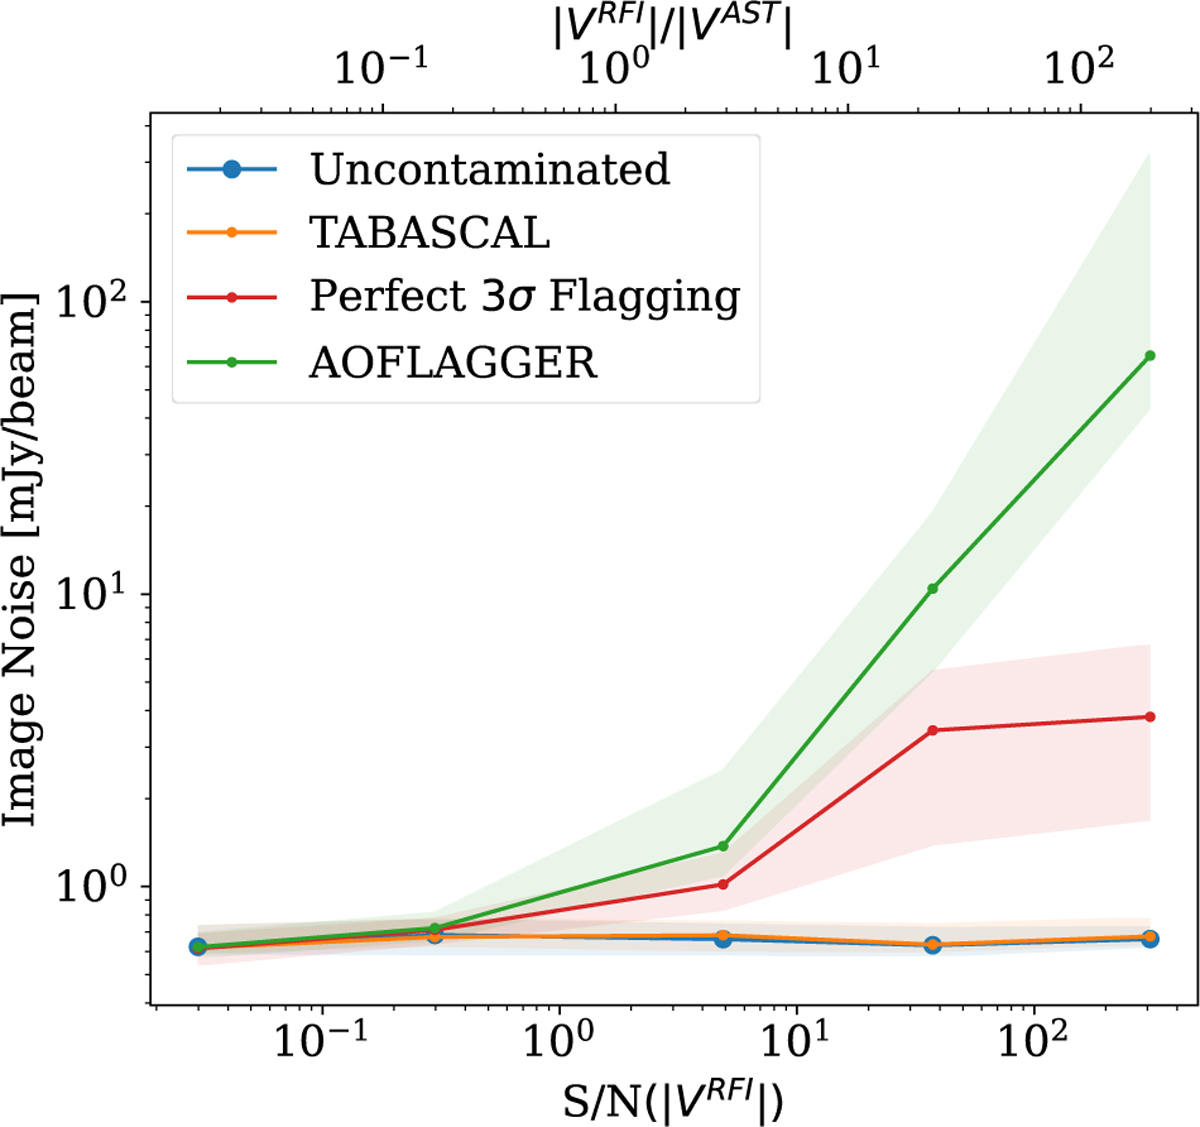
Fig. 7
Download original image
Image noise calculated from the residuals after using WSCLEAN for imaging vs RFI S/N (lower x-axis) and ratio of RFI-to-Astronomical visibility strength (upper x-axis). The solid lines with dots represent the median within an RFI bin containing roughly 16 images each. The shaded region represents the 68% uncertainty interval over the observations in the bin. TABASCAL (orange) is statistically consistent with the uncontaminated case showing successful signal recovery despite the RFI contamination across the entire range of RFI strengths. In this simulation the astronomical visibilities are chosen to be close in amplitude to the visibility noise so the upper and lower x-axis scales are similar but not identical.
Current usage metrics show cumulative count of Article Views (full-text article views including HTML views, PDF and ePub downloads, according to the available data) and Abstracts Views on Vision4Press platform.
Data correspond to usage on the plateform after 2015. The current usage metrics is available 48-96 hours after online publication and is updated daily on week days.
Initial download of the metrics may take a while.