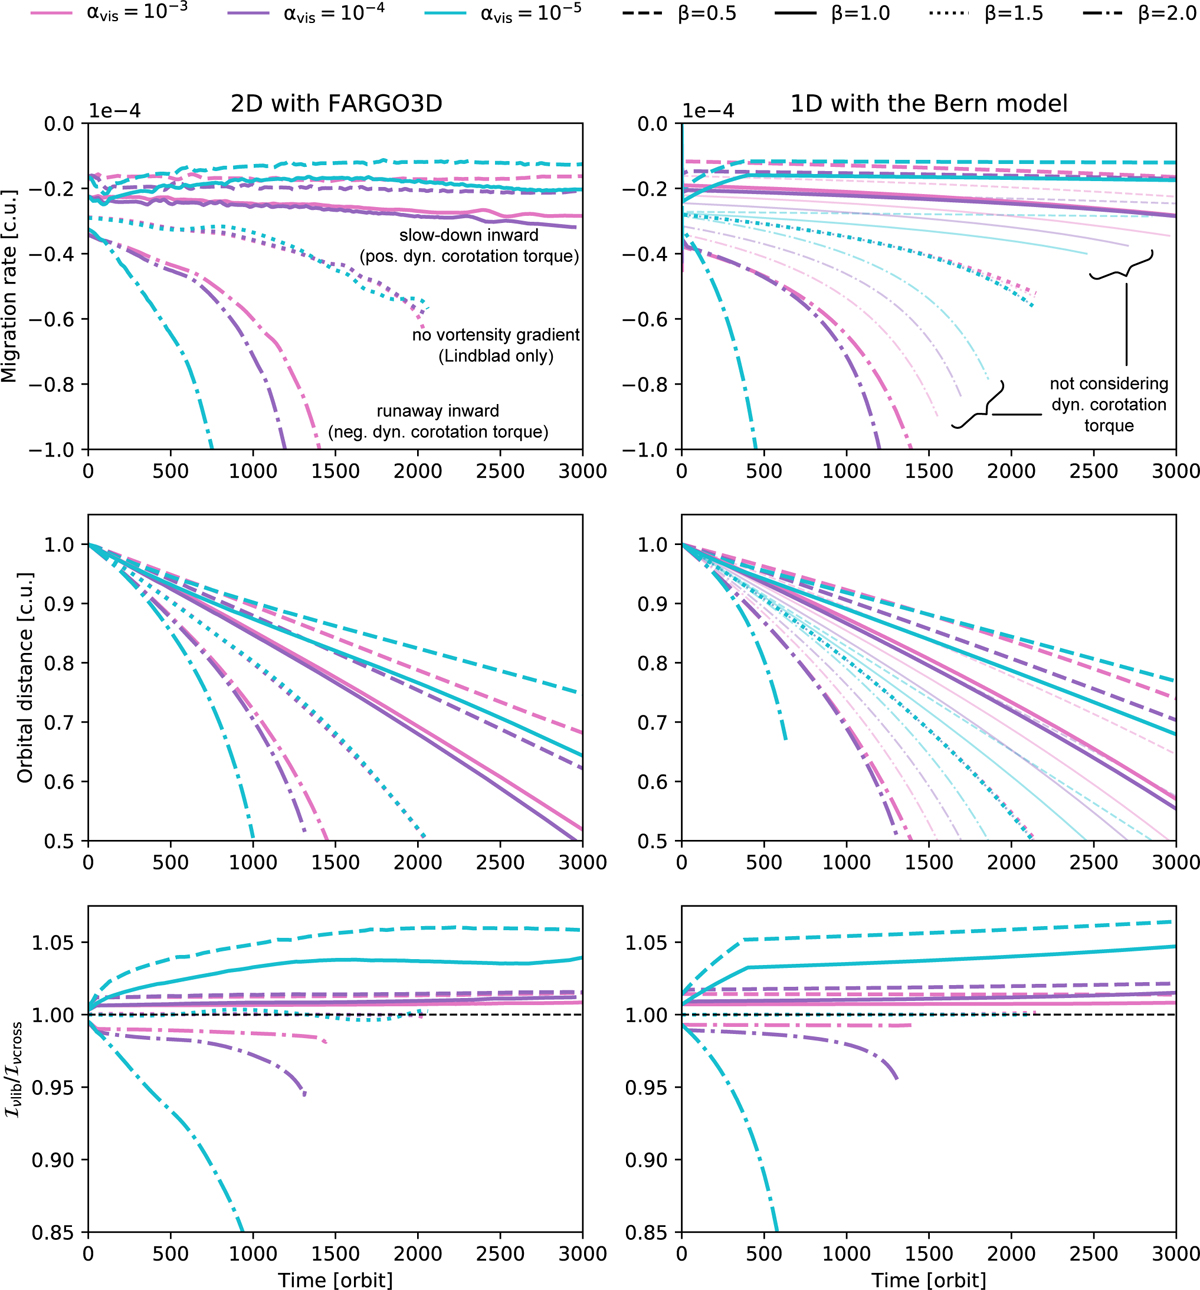
Fig. 2
Download original image
From top to bottom: time evolution of planet’s migration rate, orbital distance, and inverse vortensity ratio Iv,lib/Iv,cross for simulations with Q0 = 8. The results of our 2D (with FARGO3D) and 1D (with the Bern model) simulations are shown side by side for easy direct comparison. Lines are coloured by αvis and different line styles indicate varying slopes of the surface density, β. The migration rates of the 2D simulations (top left panel) are shown as moving averages over 100 orbits. For the 1D simulations (right), we additionally show results of simulations that discard the dynamical corotation torque as transparent lines. For an easier direct comparison of the most relevant simulations, see the left column in Figure B.1 of Appendix B.
Current usage metrics show cumulative count of Article Views (full-text article views including HTML views, PDF and ePub downloads, according to the available data) and Abstracts Views on Vision4Press platform.
Data correspond to usage on the plateform after 2015. The current usage metrics is available 48-96 hours after online publication and is updated daily on week days.
Initial download of the metrics may take a while.