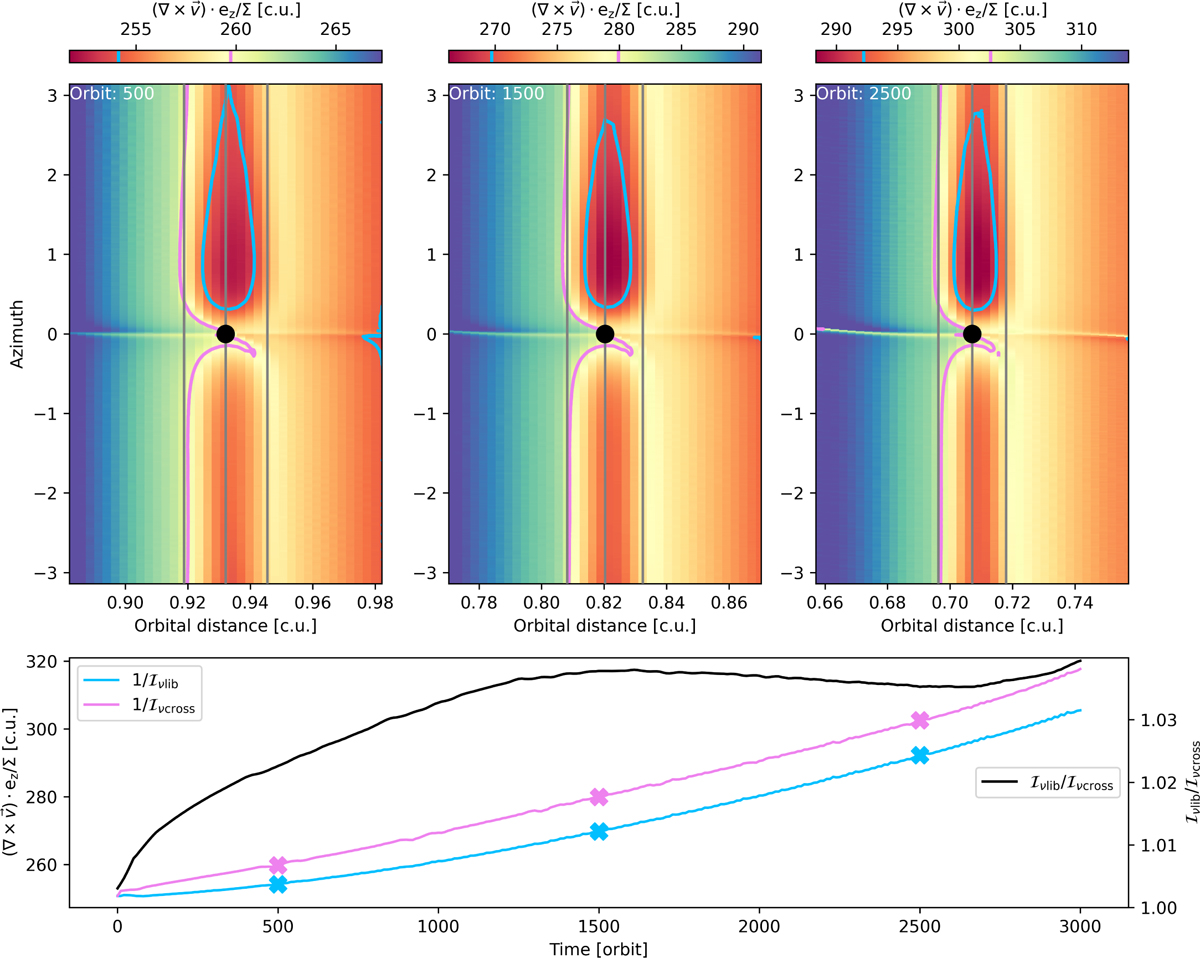
Fig. 3
Download original image
Evolution of disc vortensity for simulation with Q0 = 8, β = 1 and αvis = 10–5. The top panels show snapshots of the vortensity field around the planet at 500, 1500, and 2500 orbits. The vortensity deficit in the HS region, and the vortensity advection of the orbit-crossing flow from the inner to the outer edges of the HS region are clearly visible. The vortensities of the orbit-crossing and librating flows measured by the method described in Section 3.2.2 are shown as contour lines in pink and cyan, respectively. The grey vertical lines mark the orbital radius of the planet and the extent of its horseshoe region (see Section 2.1 for the expression of the horseshoe half-width xs). The bottom panel shows the time evolution of the measured vortensities for the orbit-crossing and librating flows. Crosses mark the results shown in the top panels. The time evolution of Iv,lib/Iv,cross is shown in black.
Current usage metrics show cumulative count of Article Views (full-text article views including HTML views, PDF and ePub downloads, according to the available data) and Abstracts Views on Vision4Press platform.
Data correspond to usage on the plateform after 2015. The current usage metrics is available 48-96 hours after online publication and is updated daily on week days.
Initial download of the metrics may take a while.