Open Access
Fig. 4
Download original image
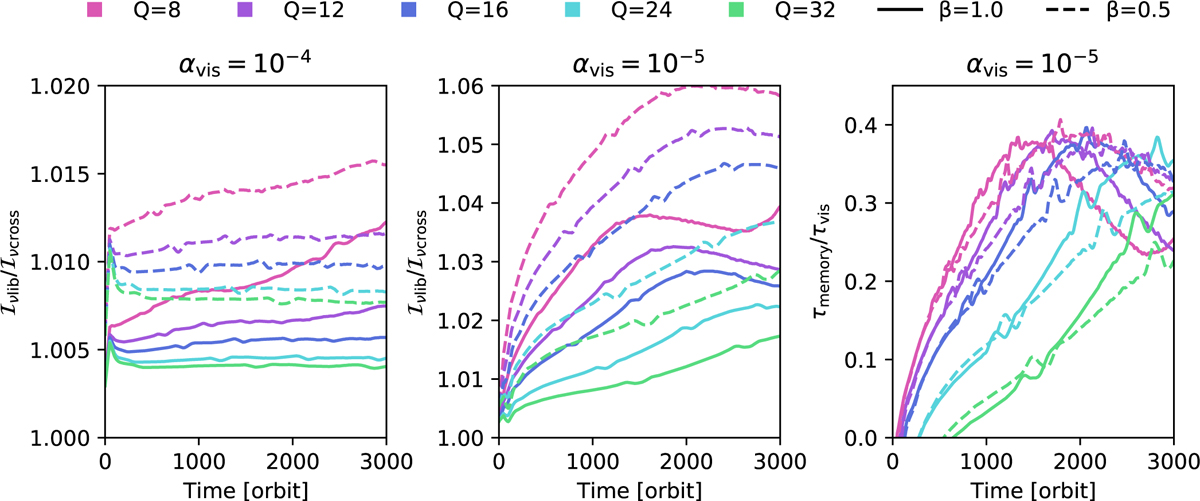
Left and middle panels: time evolution of Iv,lib/Iv,cross in simulations with varying Q0 ∈ {8, 12, 16, 24, 32}, ![]() , for αvis = 10–4 (left) and αvis = 10–5 (middle). Right panel: time evolution of ratio between memory timescale and viscous timescale across HS region for αvis = 10–5 simulations.
, for αvis = 10–4 (left) and αvis = 10–5 (middle). Right panel: time evolution of ratio between memory timescale and viscous timescale across HS region for αvis = 10–5 simulations.
Current usage metrics show cumulative count of Article Views (full-text article views including HTML views, PDF and ePub downloads, according to the available data) and Abstracts Views on Vision4Press platform.
Data correspond to usage on the plateform after 2015. The current usage metrics is available 48-96 hours after online publication and is updated daily on week days.
Initial download of the metrics may take a while.