Fig. 10
Download original image
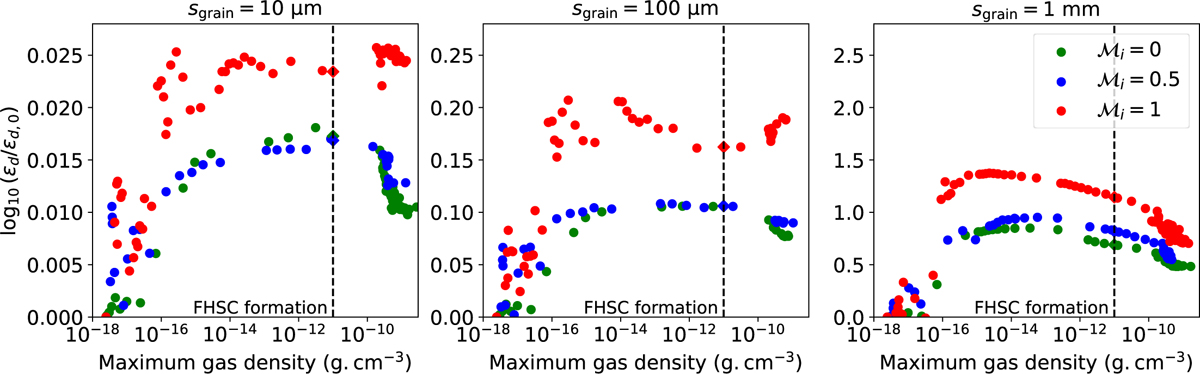
Evolution of the dust enrichment during the collapse. Logarithm of the normalized dust ratio at the maximum gas density, depending on the size of the grains (individual panels) and the initial turbulent Mach (green for ℳi = 0, blue for ℳi = 0.5, red for ℳi = 1). Diamonds on the dotted line indicate the interpolated value to get the dust enrichment within the first hydrostatic core (Table 1).
Current usage metrics show cumulative count of Article Views (full-text article views including HTML views, PDF and ePub downloads, according to the available data) and Abstracts Views on Vision4Press platform.
Data correspond to usage on the plateform after 2015. The current usage metrics is available 48-96 hours after online publication and is updated daily on week days.
Initial download of the metrics may take a while.