Fig. 7
Download original image
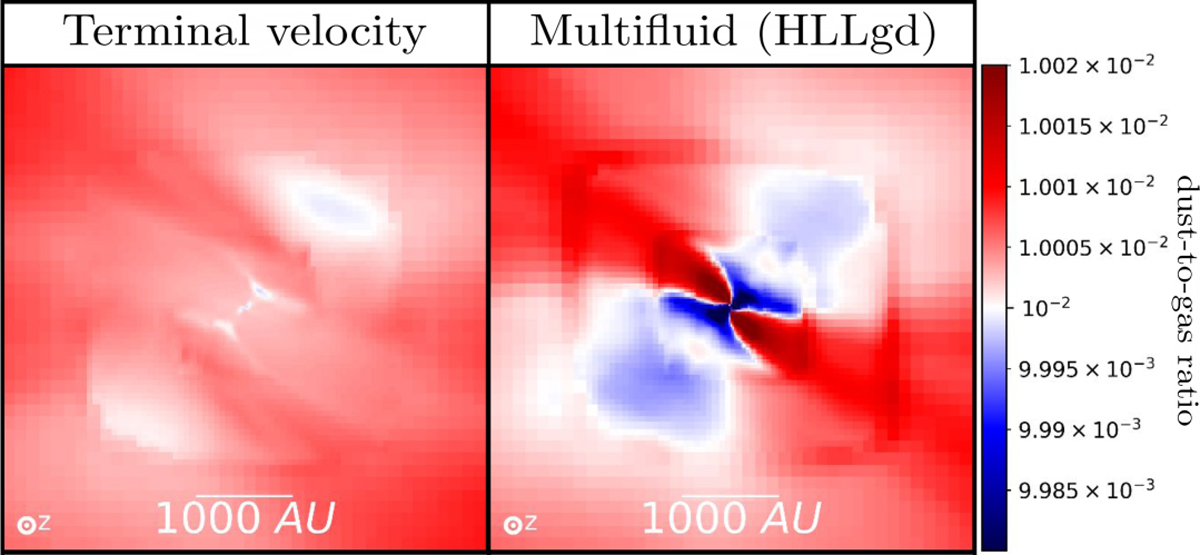
Direct comparison of the dust-to-gas ratio maps between the terminal velocity simulation (Fig. 5, right) and the multifluid simulation using the HLLgd solver with the CFL condition Δt < 0.08tCFL (Fig. 6, fourth column, second line). The colorbar scale is adapted from previous figures to emphasize the very small deviations to the initial dust-to-gas ratio of θd = 1%.
Current usage metrics show cumulative count of Article Views (full-text article views including HTML views, PDF and ePub downloads, according to the available data) and Abstracts Views on Vision4Press platform.
Data correspond to usage on the plateform after 2015. The current usage metrics is available 48-96 hours after online publication and is updated daily on week days.
Initial download of the metrics may take a while.