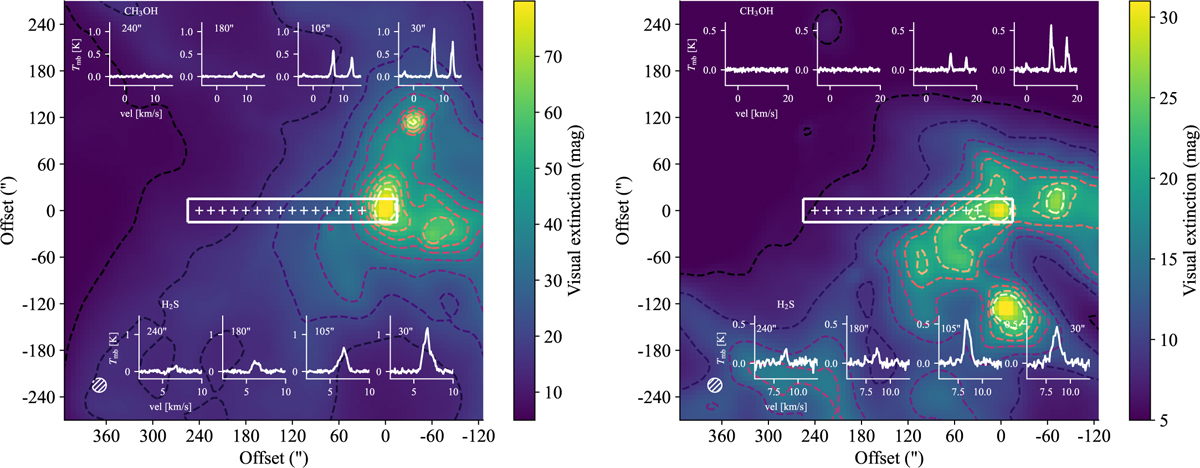
Fig. 1
Download original image
Visual extinction maps of the observed regions. The contours in the Barnard 1b map (left) correspond to [7,14,21,28, 35,42,49,56,63,70] mag levels. The contours in the IC 348 map (right) correspond to [6,9,12,15,18,21,24] mag levels. These maps were obtained from the τ850 optical depth maps in Zari et al. (2016) applying the K-band to V-band extinction ratio of ~1/16 (Nishiyama et al. 2008). The crosses mark the pointings from where the data were taken. Selected spectra of CH3OH lines at 90 GHz (Table 2) and the H2S 11,0 → 10,1 line observed at different offsets are included in the maps.
Current usage metrics show cumulative count of Article Views (full-text article views including HTML views, PDF and ePub downloads, according to the available data) and Abstracts Views on Vision4Press platform.
Data correspond to usage on the plateform after 2015. The current usage metrics is available 48-96 hours after online publication and is updated daily on week days.
Initial download of the metrics may take a while.