Fig. 12
Download original image
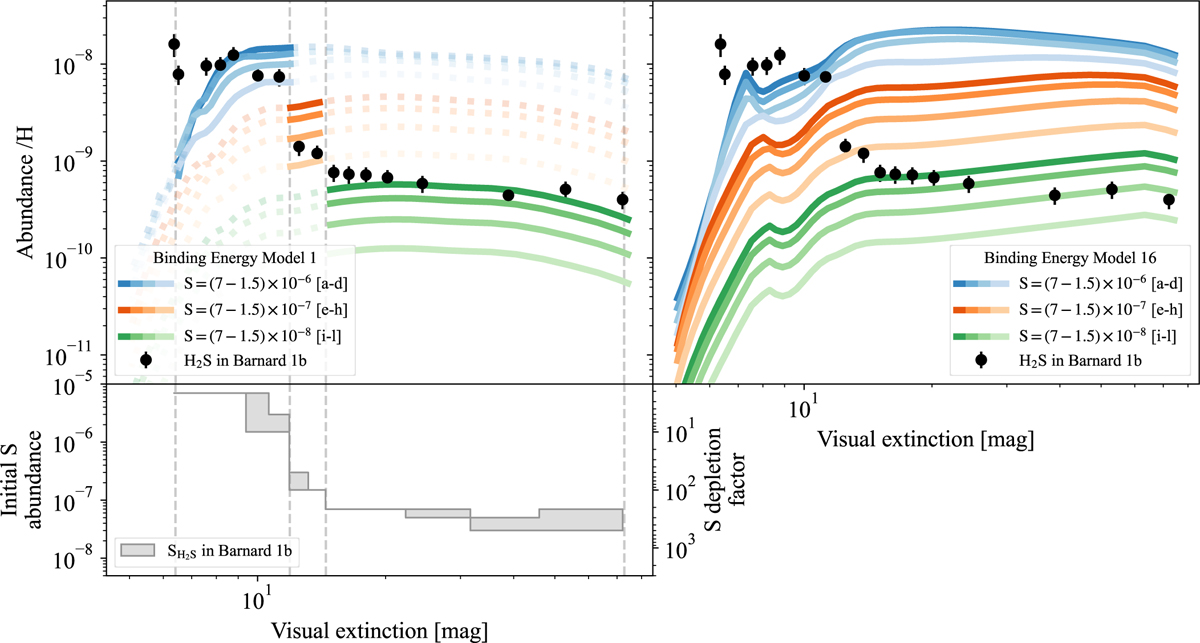
Comparison between the observed abundance of H2S in Barnard 1b (black dots) and the chemical models. In the left panel of the top row, the observed abundances are compared to models with different initial sulfur abundances and the binding energies of Model 1 from Table 8. The sets of models that best fit the observations are shown with solid lines. The top right panel shows the same comparison, but with the binding energies of Model 16 from Table 8, evidencing the low impact of lower binding energies in the predicted gas-phase abundances of H2S. The dependence between the sulfur abundance and the extinction is shown in the bottom left panel. The filled area SH2S represents the appropriate ranges of sulfur abundances that models with other sets of binding energies,apart from Model 1 (Table 8), require.
Current usage metrics show cumulative count of Article Views (full-text article views including HTML views, PDF and ePub downloads, according to the available data) and Abstracts Views on Vision4Press platform.
Data correspond to usage on the plateform after 2015. The current usage metrics is available 48-96 hours after online publication and is updated daily on week days.
Initial download of the metrics may take a while.