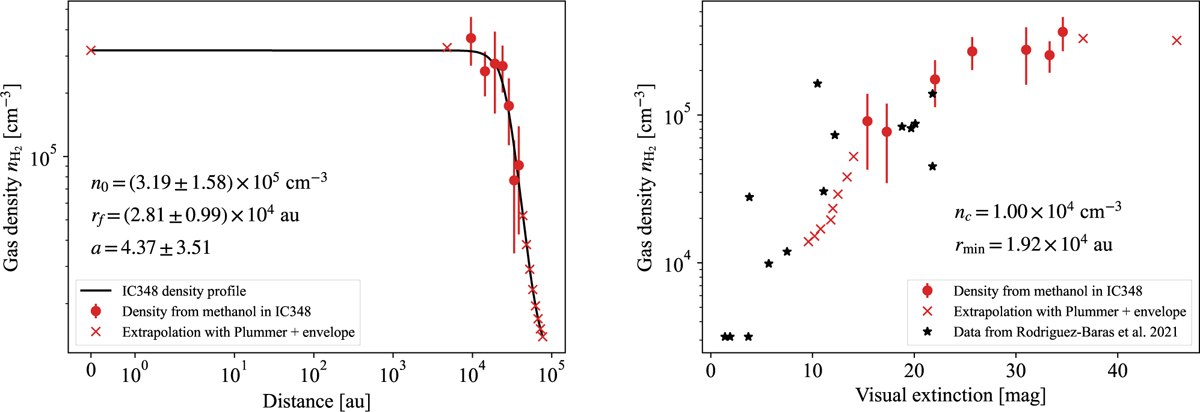
Fig. 4
Download original image
Density across the observed strip in IC 348. Left: Plummer-like profile and envelope (black solid line) that best fit the density derived from methanol integrated intensities (red dots). The red crosses mark the density that would correspond to the points where an estimation using methanol was not possible. Right: parameters of the envelope chosen so that the density at the outermost areas (red dots and crosses) matches the values of density from Rodríguez-Baras et al. (2021) (black stars) found at points of similar extinction in the same region.
Current usage metrics show cumulative count of Article Views (full-text article views including HTML views, PDF and ePub downloads, according to the available data) and Abstracts Views on Vision4Press platform.
Data correspond to usage on the plateform after 2015. The current usage metrics is available 48-96 hours after online publication and is updated daily on week days.
Initial download of the metrics may take a while.