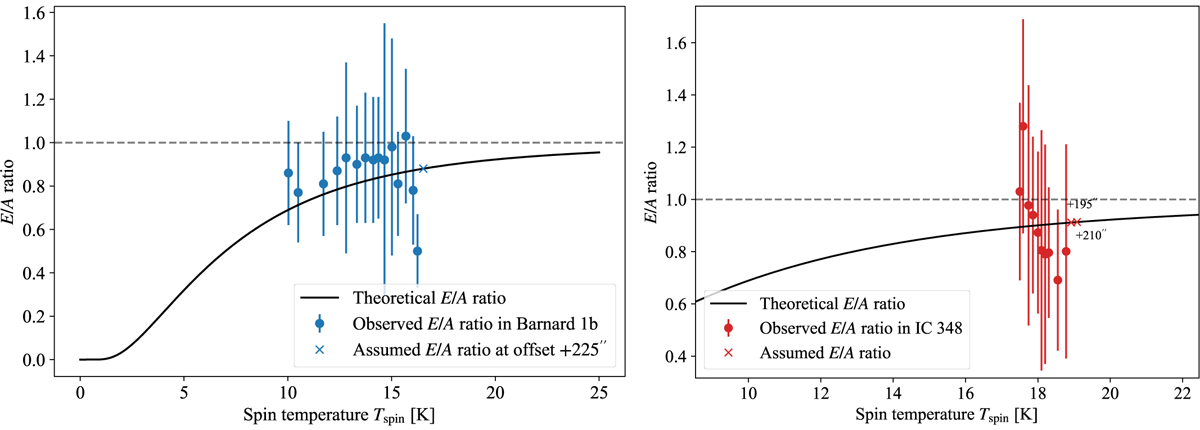
Fig. 5
Download original image
Theoretical methanol E/A ratios (black solid line) compared to those observed in Barnard 1b (blue dots, left panel) and IC 348 (red dots, right panel). The blue and red crosses indicate that the E/A ratio used to estimate the total methanol column density is set to be equal to the theoretical value. The horizontal dashed line corresponds to the statistical 1:1 ratio.
Current usage metrics show cumulative count of Article Views (full-text article views including HTML views, PDF and ePub downloads, according to the available data) and Abstracts Views on Vision4Press platform.
Data correspond to usage on the plateform after 2015. The current usage metrics is available 48-96 hours after online publication and is updated daily on week days.
Initial download of the metrics may take a while.