Open Access
Fig. 7
Download original image
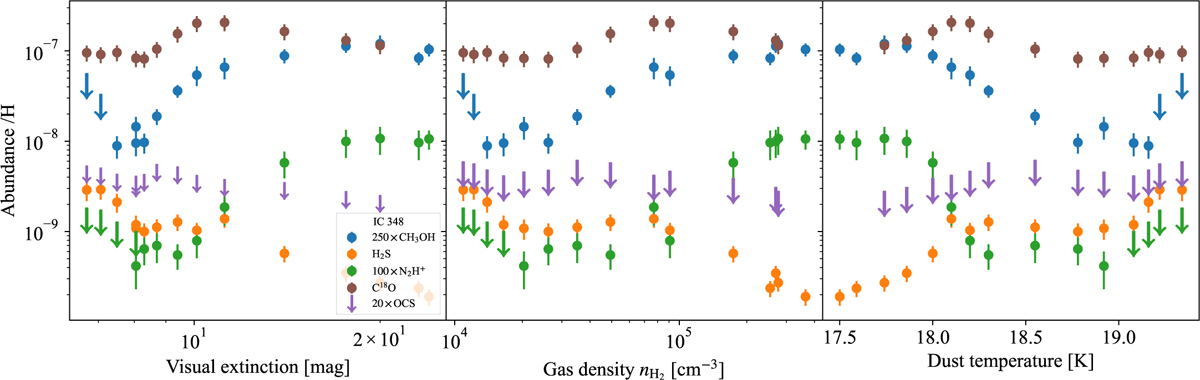
Scaled gas-phase abundances of methanol (blue dots), H2S (orange dots), N2H+ (green dots), C18O (brown dots), and OCS (purple dots) in IC348 as a function of the visual extinction (left panel), gas density nH2 (middle panel), and dust temperature (right panel).
Current usage metrics show cumulative count of Article Views (full-text article views including HTML views, PDF and ePub downloads, according to the available data) and Abstracts Views on Vision4Press platform.
Data correspond to usage on the plateform after 2015. The current usage metrics is available 48-96 hours after online publication and is updated daily on week days.
Initial download of the metrics may take a while.