Fig. 6.
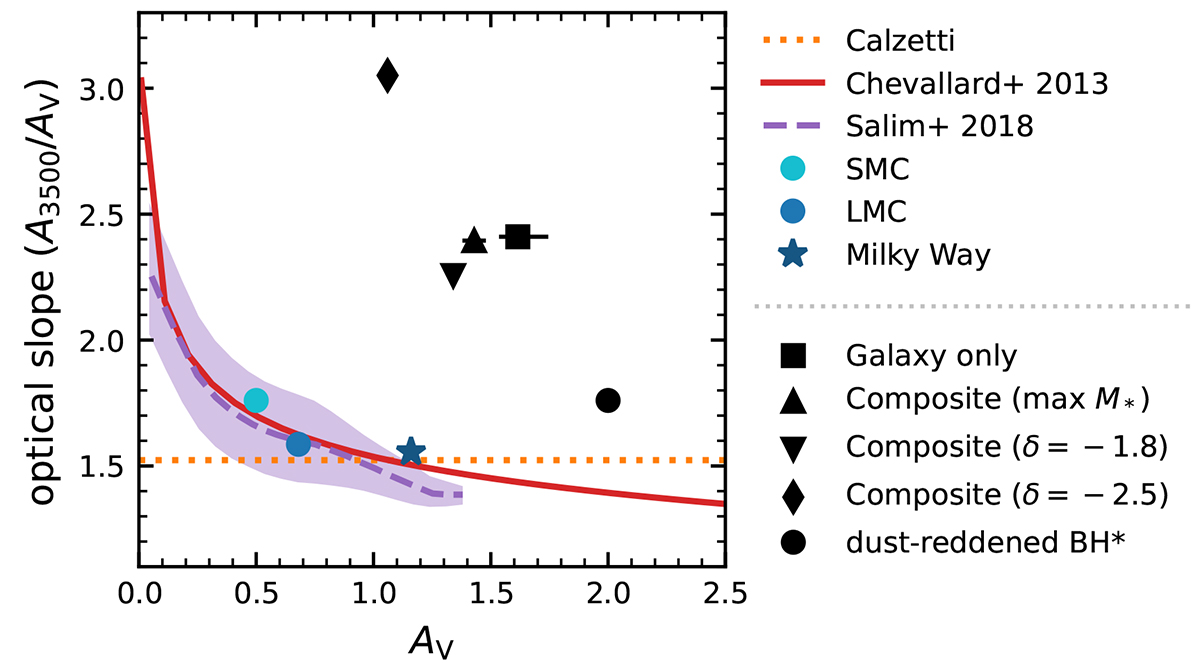
Download original image
Optical dust attenuation slope across the Balmer break (A3500/AV) vs. the optical attenuation AV. Radiative transfer models predict a strong correlation between the slope and optical depth (Chevallard et al. 2013), which closely matches observed dust curves (Gordon et al. 2003, 2009; Salim et al. 2018). The various black symbols denote optical slopes and depths implied by the SED models of The Cliff from Section 5 (medians are shown with 16–84 percentiles, although these error bars are in most cases smaller than the markers), which deviate strongly from this trend. The dust-reddened BH* model is discussed in Section 6.4.
Current usage metrics show cumulative count of Article Views (full-text article views including HTML views, PDF and ePub downloads, according to the available data) and Abstracts Views on Vision4Press platform.
Data correspond to usage on the plateform after 2015. The current usage metrics is available 48-96 hours after online publication and is updated daily on week days.
Initial download of the metrics may take a while.