Fig. 4
Download original image
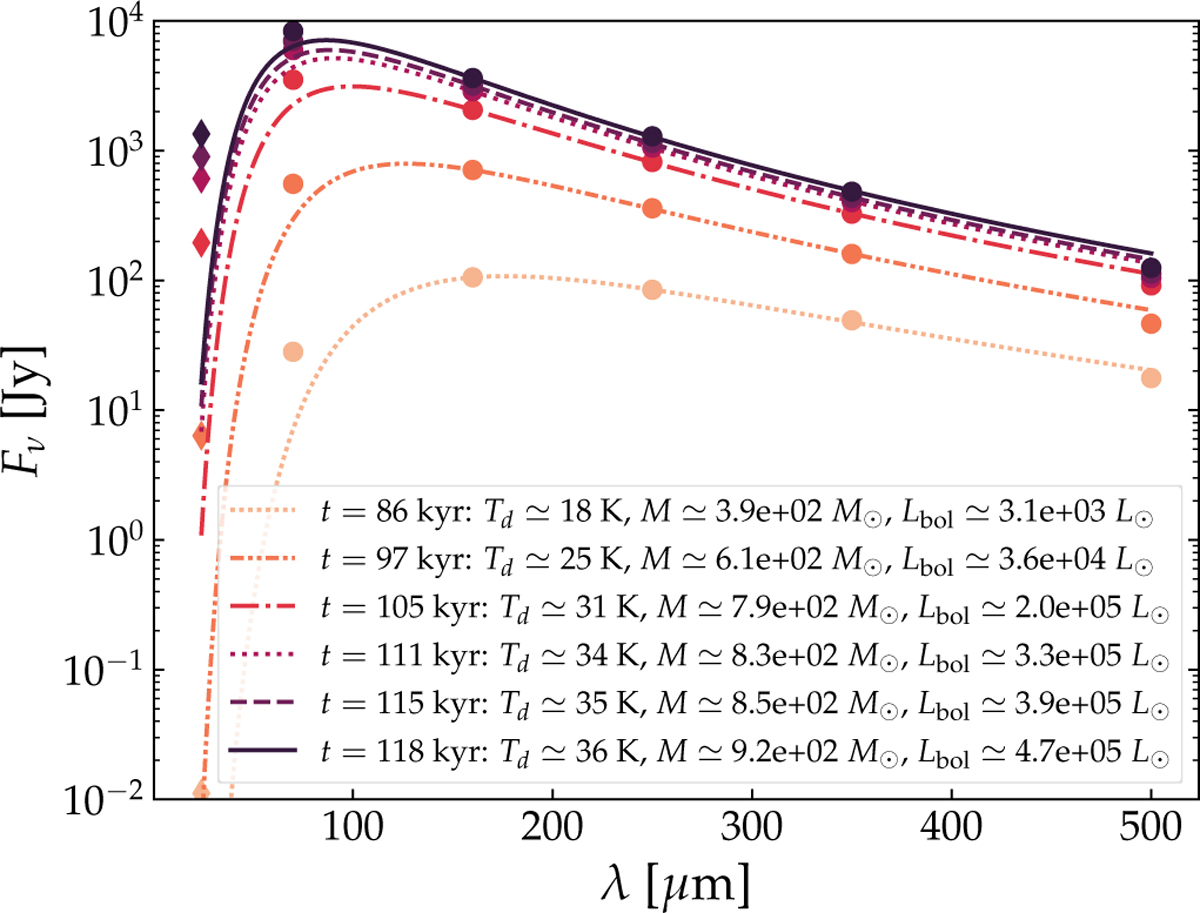
Time evolution of the spectral energy distribution (SED) of the clump shown in Fig. 3. The circle markers show the fluxes of the source as identified by Hyper, whereas the diamond markers indicate the additional fluxes at 24 µm used for the bolometric luminosity calculation. The area under this SED is integrated to determine the Lbol . The optically thin fluxes at 160, 250, 350, and 500 μm are fitted to a graybody to determine the mass and the average temperature of the clumps. The results of these calculations for this clump are noted in the legend of the figure.
Current usage metrics show cumulative count of Article Views (full-text article views including HTML views, PDF and ePub downloads, according to the available data) and Abstracts Views on Vision4Press platform.
Data correspond to usage on the plateform after 2015. The current usage metrics is available 48-96 hours after online publication and is updated daily on week days.
Initial download of the metrics may take a while.