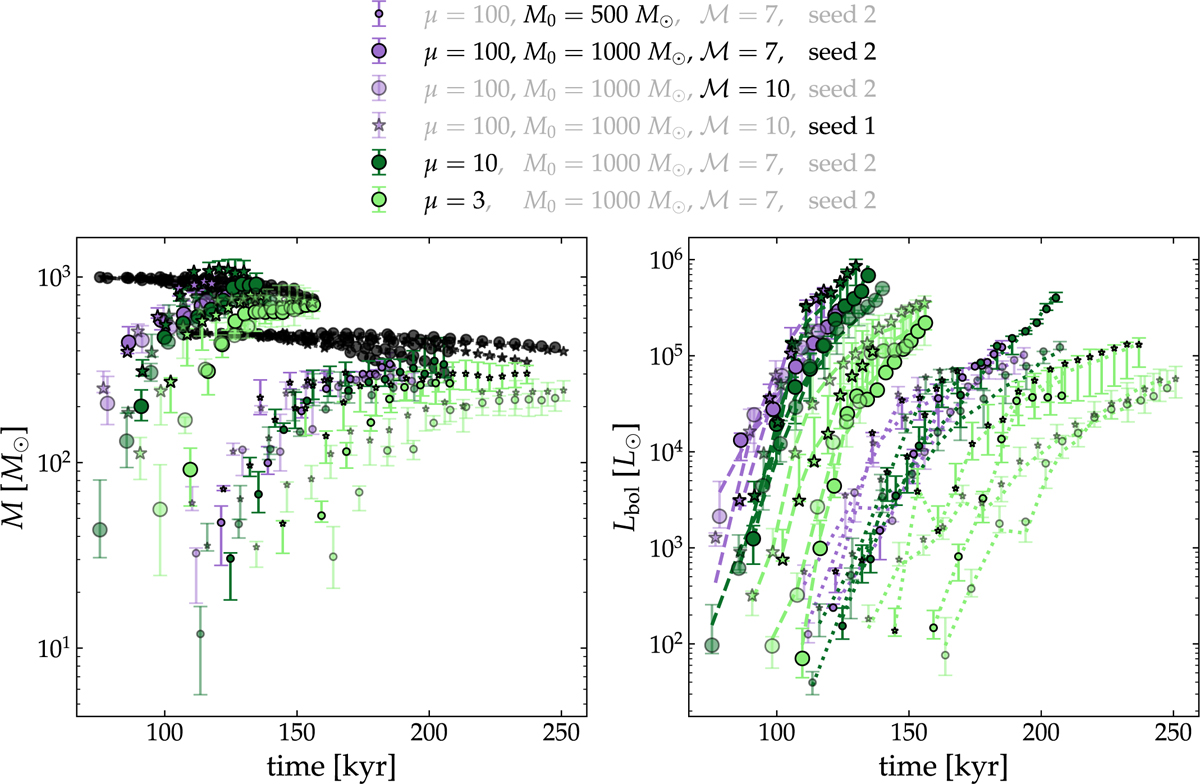
Fig. 5
Download original image
Masses of the clumps (left panel) and bolometric luminosities Lbol (right panel) extracted with HYPER as a function of the physical time in the simulation. The black points in the left panel mark the closest values inferred from the simulations corresponding to the total gas mass within the clumps minus the mass that ended up in sinks. The total luminosity of all the stars present in the simulation snapshots is plotted by the dashed (for 1000 M⊙ initial clumps) and dotted (for 500 M⊙ clumps) lines, whose color coincides with that of the markers for the inferred bolometric luminosity from the synthetic observations. These lines are followed closely by their respective data points, suggesting good agreement between the reconstructed Lbol and the total sink luminosities. The error bars indicate the variation of the retrieved values along the three projections considered. Here the change in the colors of the markers indicate the different values of μ, the change in transparency the two values of M (less transparency for M = 10), the change in marker sizes for the initial mass of the clumps (smaller for less massive), and the change in marker types for the seeds of turbulence (stars for seed 1 and circles for seed 2). A representative choice of marker types, sizes, colors, and transparencies are reflect by the parameters in black in the legend, whereas the ones in gray are the parameters of the exact marker they label.
Current usage metrics show cumulative count of Article Views (full-text article views including HTML views, PDF and ePub downloads, according to the available data) and Abstracts Views on Vision4Press platform.
Data correspond to usage on the plateform after 2015. The current usage metrics is available 48-96 hours after online publication and is updated daily on week days.
Initial download of the metrics may take a while.