Open Access
Fig. 6
Download original image
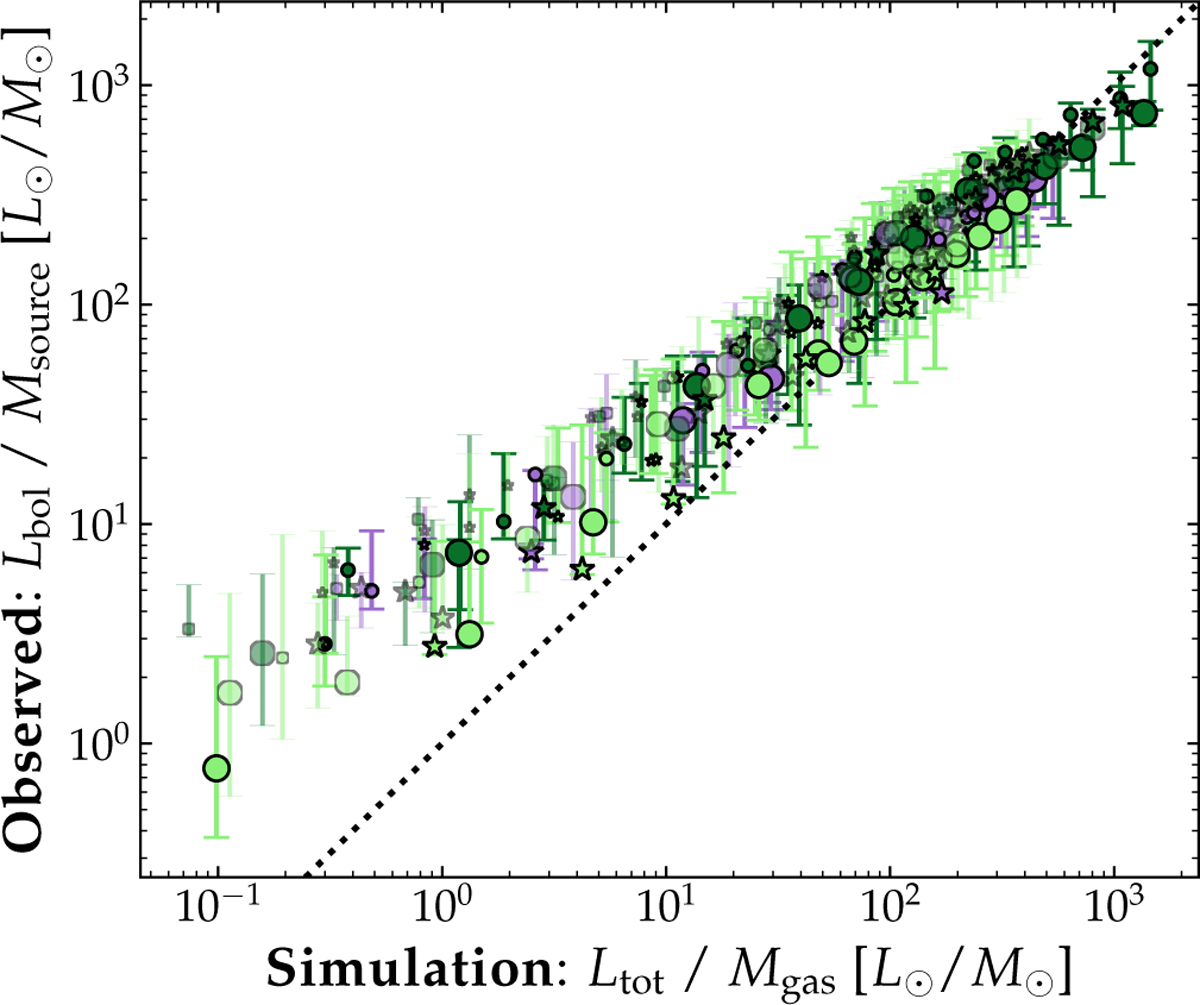
L/M computed from our synthetic observations vs. L/M derived from the simulations. As expected from the results shown in Fig. 5, in the early time steps the observed L/M is overestimated, as a consequence of the underestimation of the clump mass, and around L/M ≃ 10 the observed and the simulated L/M starts to converge.
Current usage metrics show cumulative count of Article Views (full-text article views including HTML views, PDF and ePub downloads, according to the available data) and Abstracts Views on Vision4Press platform.
Data correspond to usage on the plateform after 2015. The current usage metrics is available 48-96 hours after online publication and is updated daily on week days.
Initial download of the metrics may take a while.