Fig. 1
Download original image
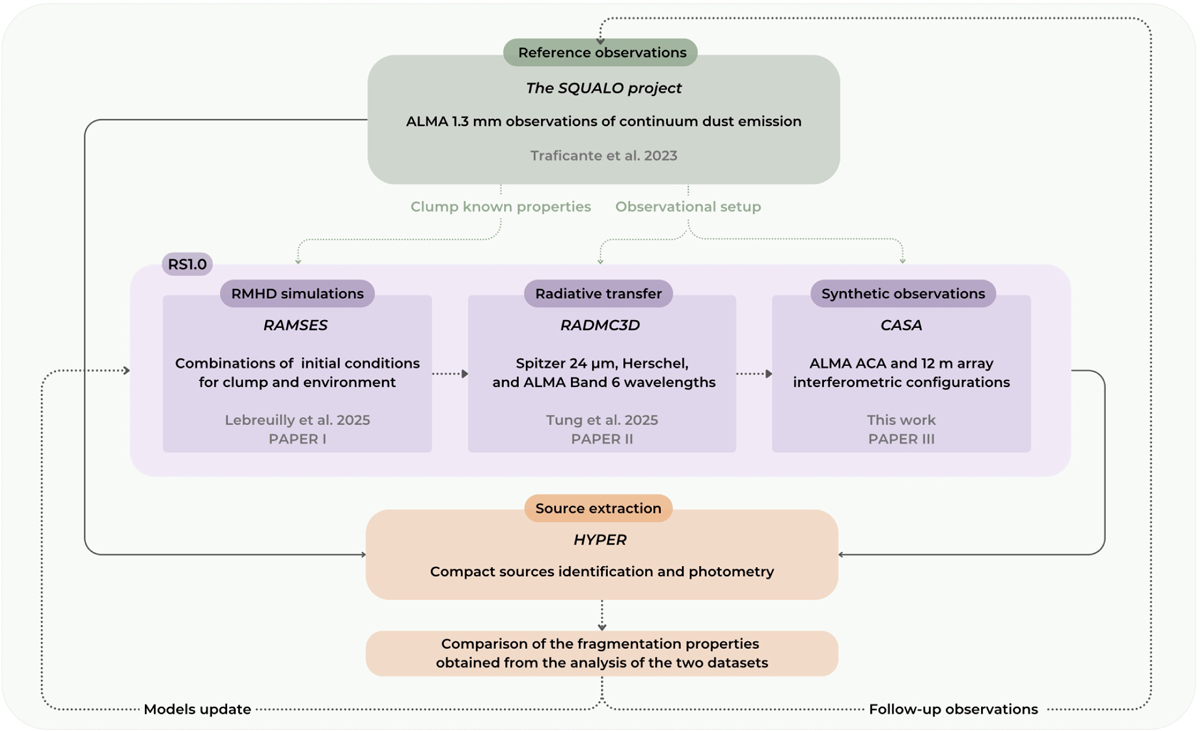
Flowchart of the Rosetta Stone end-to-end framework: scheme of the comparison between observations and simulations by means of the production of realistic synthetic observations. Real data and inherent information are highlighted in green, synthetic data (RMHD simulations, radiative transfer, synthetic observations) in purple, and the steps of the analysis performed on both real and synthetic maps in orange. In the lighter-shaded boxes we specify how the building blocks of the Rosetta Stone framework have been adapted in this work for the SQUALO project (Traficante et al. 2023) science case.
Current usage metrics show cumulative count of Article Views (full-text article views including HTML views, PDF and ePub downloads, according to the available data) and Abstracts Views on Vision4Press platform.
Data correspond to usage on the plateform after 2015. The current usage metrics is available 48-96 hours after online publication and is updated daily on week days.
Initial download of the metrics may take a while.