Fig. 11
Download original image
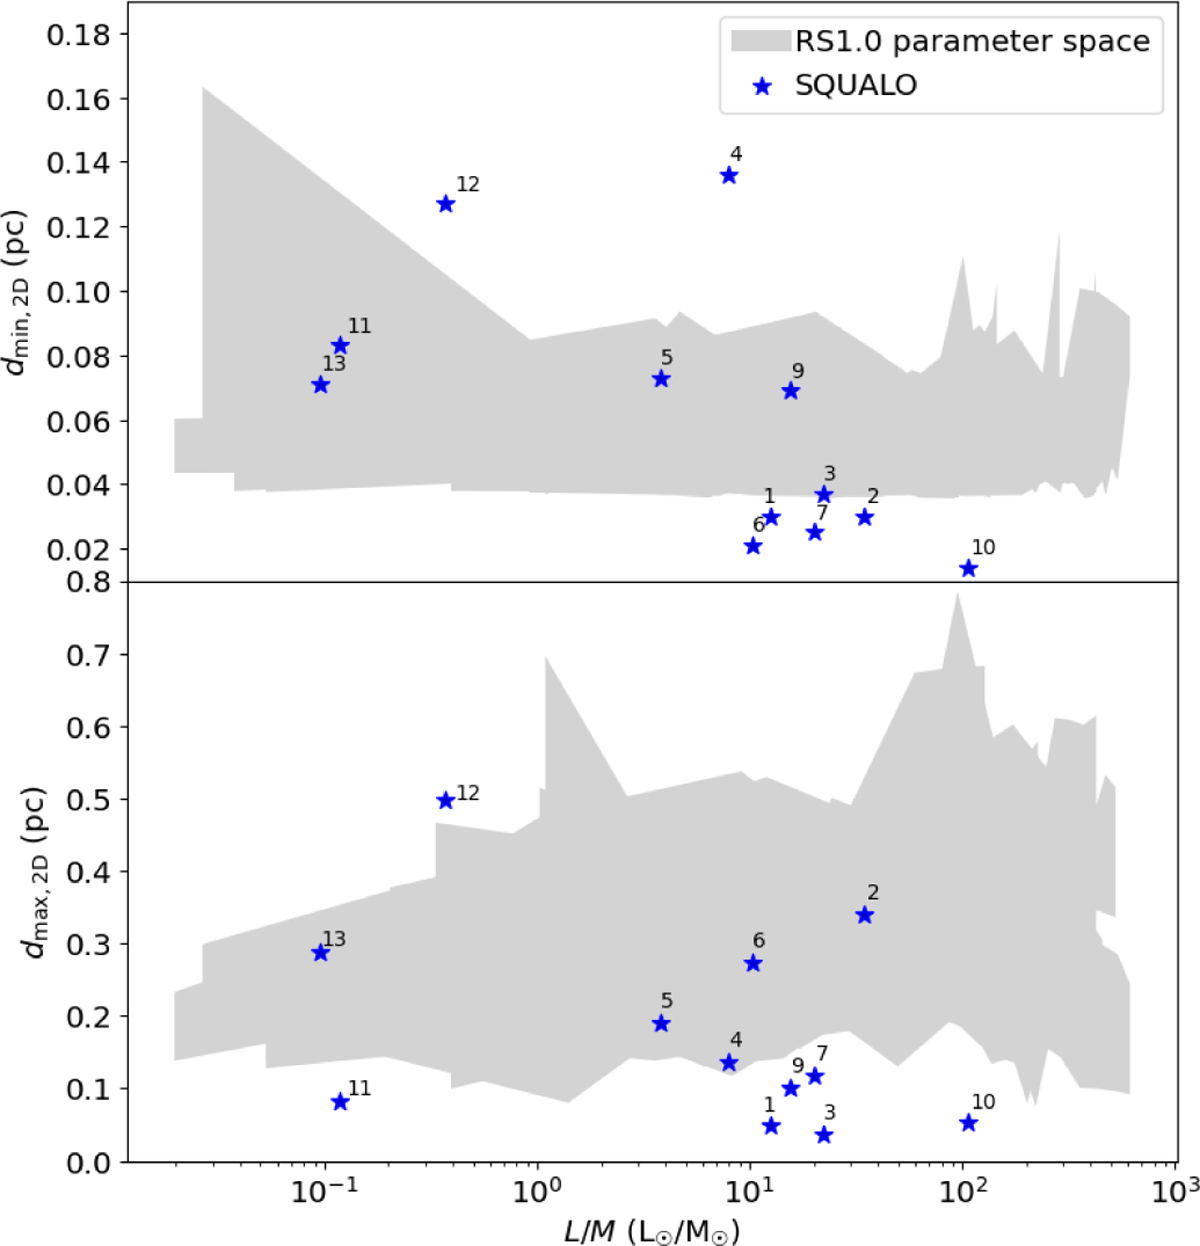
Top: minimum distance between fragments as a function of the clump L/M and comparison with the SQUALO sample. Bottom: maximum distance between fragments as a function of the clump L/M and comparison with the SQUALO sample. All the combinations of parameters presented in Table 1 are included in the gray area. The stars mark the minimum and maximum distances between fragments for the 13 clumps of the SQUALO sample.
Current usage metrics show cumulative count of Article Views (full-text article views including HTML views, PDF and ePub downloads, according to the available data) and Abstracts Views on Vision4Press platform.
Data correspond to usage on the plateform after 2015. The current usage metrics is available 48-96 hours after online publication and is updated daily on week days.
Initial download of the metrics may take a while.