Fig. D.1
Download original image
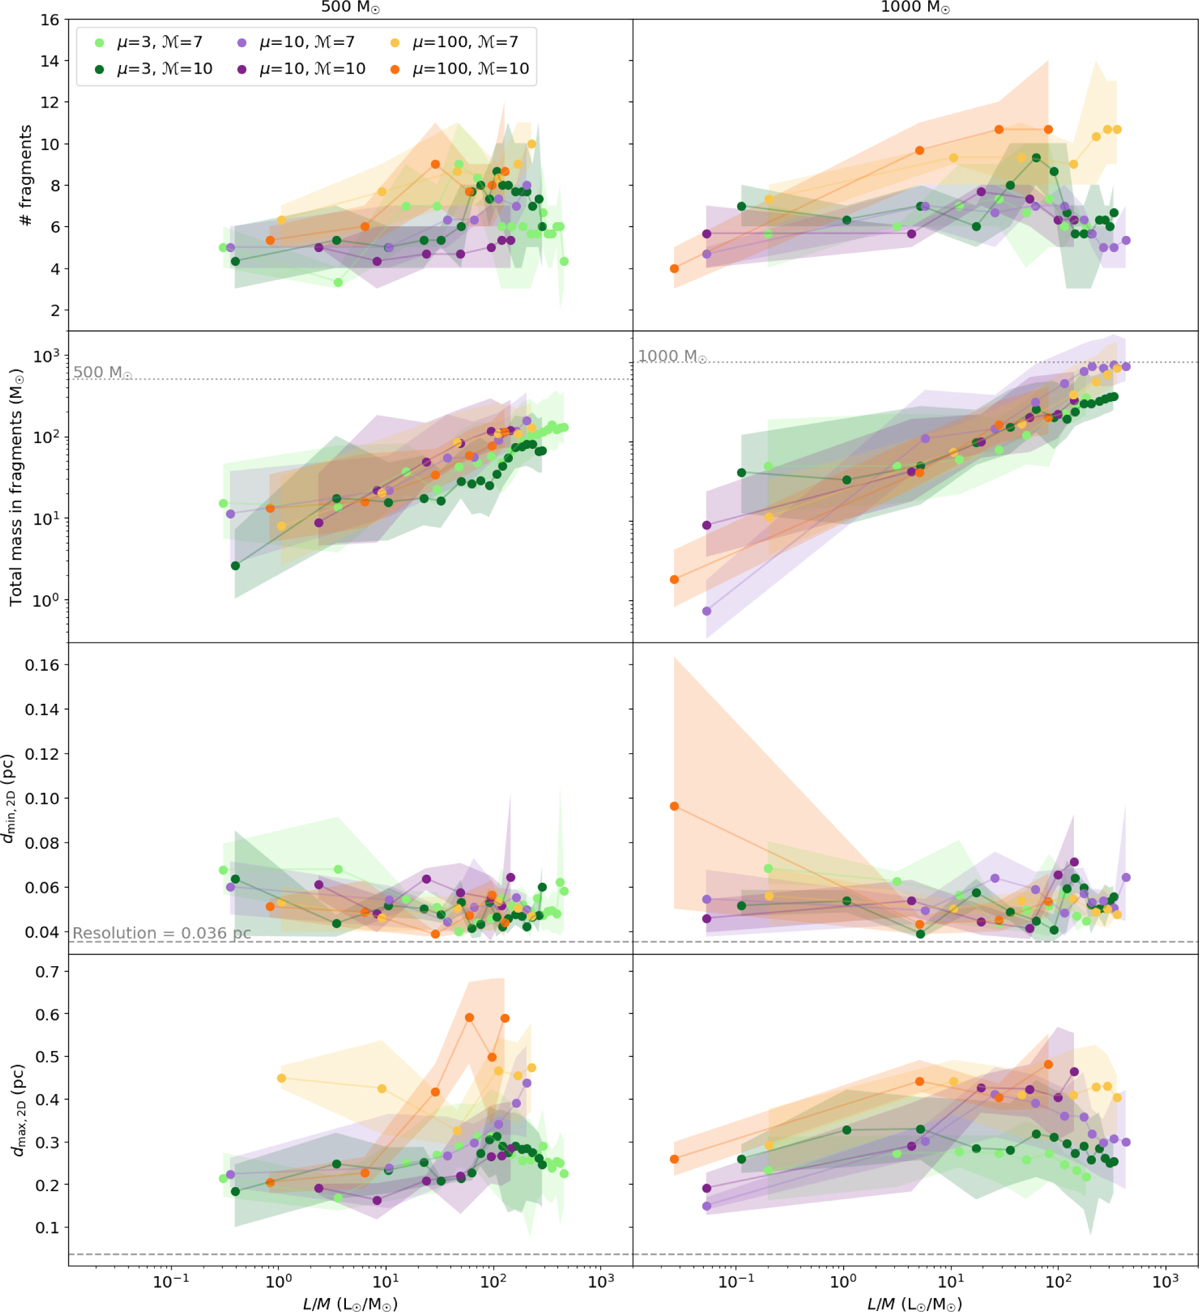
Top to bottom: Number of fragments identified in each clump, total mass accreted onto the fragments, minimum and maximum distances between the fragments as a function of the clump L/M. Results from S1 realizations. Left: Realizations with initial clump mass of 500 M⊙. Right: Realizations with initial clump mass of 1000 M⊙. Shaded areas illustrate the span of the analyzed quantities across the three projections, indicating the uncertainty in the respective distributions. Only in the case of the total mass in fragments, the shaded areas represent the stochastic variations of fragments temperature due to 1000 MC runs. The color code accounts for the different initial conditions of the realizations, as described in Fig. 5.
Current usage metrics show cumulative count of Article Views (full-text article views including HTML views, PDF and ePub downloads, according to the available data) and Abstracts Views on Vision4Press platform.
Data correspond to usage on the plateform after 2015. The current usage metrics is available 48-96 hours after online publication and is updated daily on week days.
Initial download of the metrics may take a while.