Fig. E.1
Download original image
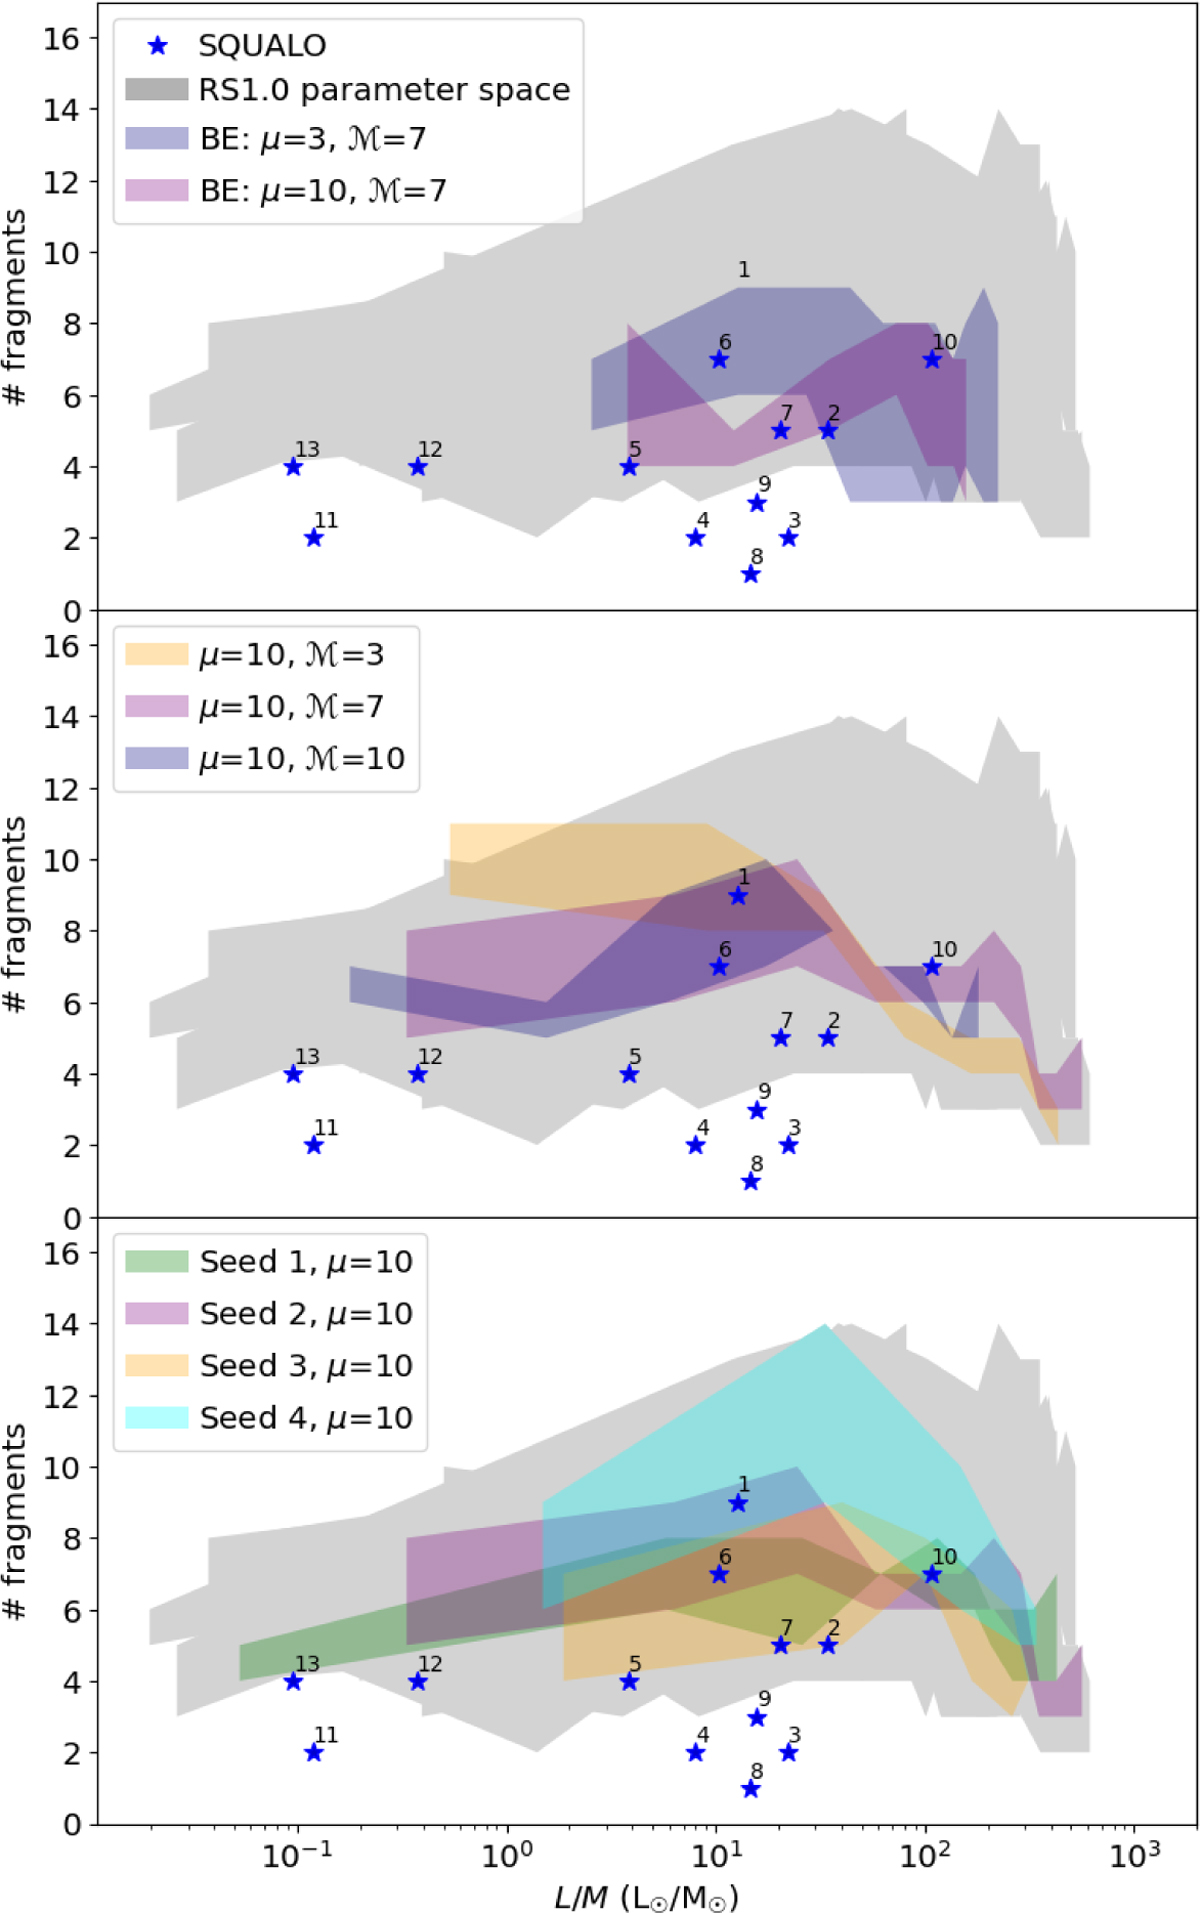
Parameter space exploration of the control models. Number of fragments as function of L/M: comparison with the SQUALO sample. All the combinations of parameters presented in Table 1 are included in the gray area. In the top panel, the blue and the purple shaded areas identify two models initialized with a Bonnor-Ebert density profile: M1000_µ3_M7_S 2_BE and M1000_µ10_M7_S 2_BE, respectively. In the central panel, the yellow shaded area identifies the M1000_µ10_M3_S2 realization produced to test the effect on the fragmentation of a lower value of turbulence. It is compared with two models from the RS1.0 suite, i.e., M1000_µ10_M7_S2 and M1000_µ10_M10_S2, in purple and blue, respectively. In the bottom panel, the yellow and the cyan shaded areas identify the M1000_µ10_M7_S3 and M1000_µ10_M7_S4 realizations, respectively, produced to test the effect of of two additional seeds on the fragmentation. They are compared with two models from the RS1.0 suite, i.e., M1000_µ10_M7_S1 and M1000_µ10_M7_S2, in green and purple, respectively.
Current usage metrics show cumulative count of Article Views (full-text article views including HTML views, PDF and ePub downloads, according to the available data) and Abstracts Views on Vision4Press platform.
Data correspond to usage on the plateform after 2015. The current usage metrics is available 48-96 hours after online publication and is updated daily on week days.
Initial download of the metrics may take a while.