Fig. 2
Download original image
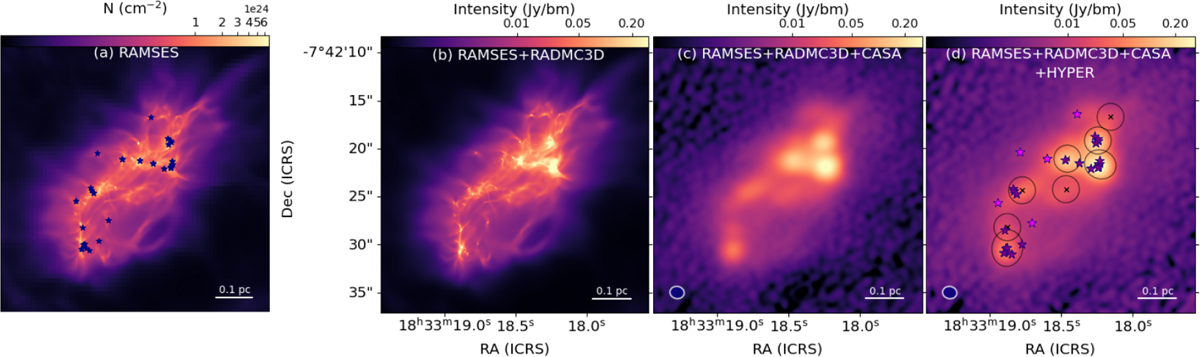
Example of the post-processing routine on a snapshot of clump collapse. This snapshot, belonging to the Μ1000_μ 10_M7_S2 realization, corresponds to an intermediate level of SFE (~15%). The displayed projection corresponds to the x-axis, i.e., the y - z plane. Left to right: (a) column density map obtained projecting the RAMSES volume density cube. The blue stars mark the projected positions of the sink particles; (b) intensity map after the RADMC-3D computation of the radiative transfer at 1.3 mm; (c) synthetic intensity map after the post processing performed with the CASA software; (d) source extraction and photometry performed by means of the Hyper software. The peaks identification is performed on the synthetic map in (c). Then, source photometry is computed on the PB corrected map, which takes into account the synthetic beam obtained by the combination of synthetic observations with both the 7 m and 12 m arrays. The black crosses and ellipses mark the centroids and the contours of the 8 identified fragments. Sink particles with and without a fragment counterpart are shown as purple and magenta stars, respectively. In each map we show the linear scale corresponding to 0.1 pc, and in the steps involving CASA software we also show the 1.29″×1.51″ synthetic beam footprint.
Current usage metrics show cumulative count of Article Views (full-text article views including HTML views, PDF and ePub downloads, according to the available data) and Abstracts Views on Vision4Press platform.
Data correspond to usage on the plateform after 2015. The current usage metrics is available 48-96 hours after online publication and is updated daily on week days.
Initial download of the metrics may take a while.