Open Access
Fig. 3
Download original image
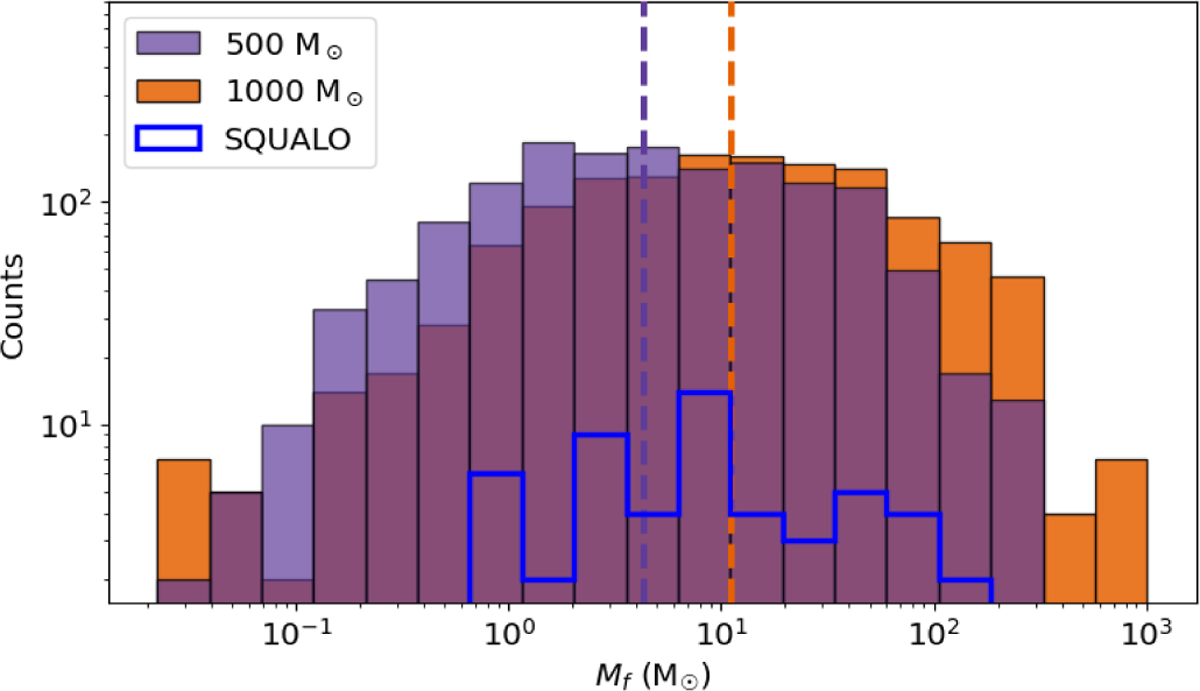
Mass distribution. The distributions relative to the M500 and M1000 samples are displayed in purple and orange, respectively. The dashed vertical lines represent the median values of 4 and 11 M⊙. The mass distribution relative to the SQUALO sample is overlaid in blue.
Current usage metrics show cumulative count of Article Views (full-text article views including HTML views, PDF and ePub downloads, according to the available data) and Abstracts Views on Vision4Press platform.
Data correspond to usage on the plateform after 2015. The current usage metrics is available 48-96 hours after online publication and is updated daily on week days.
Initial download of the metrics may take a while.