Fig. 4
Download original image
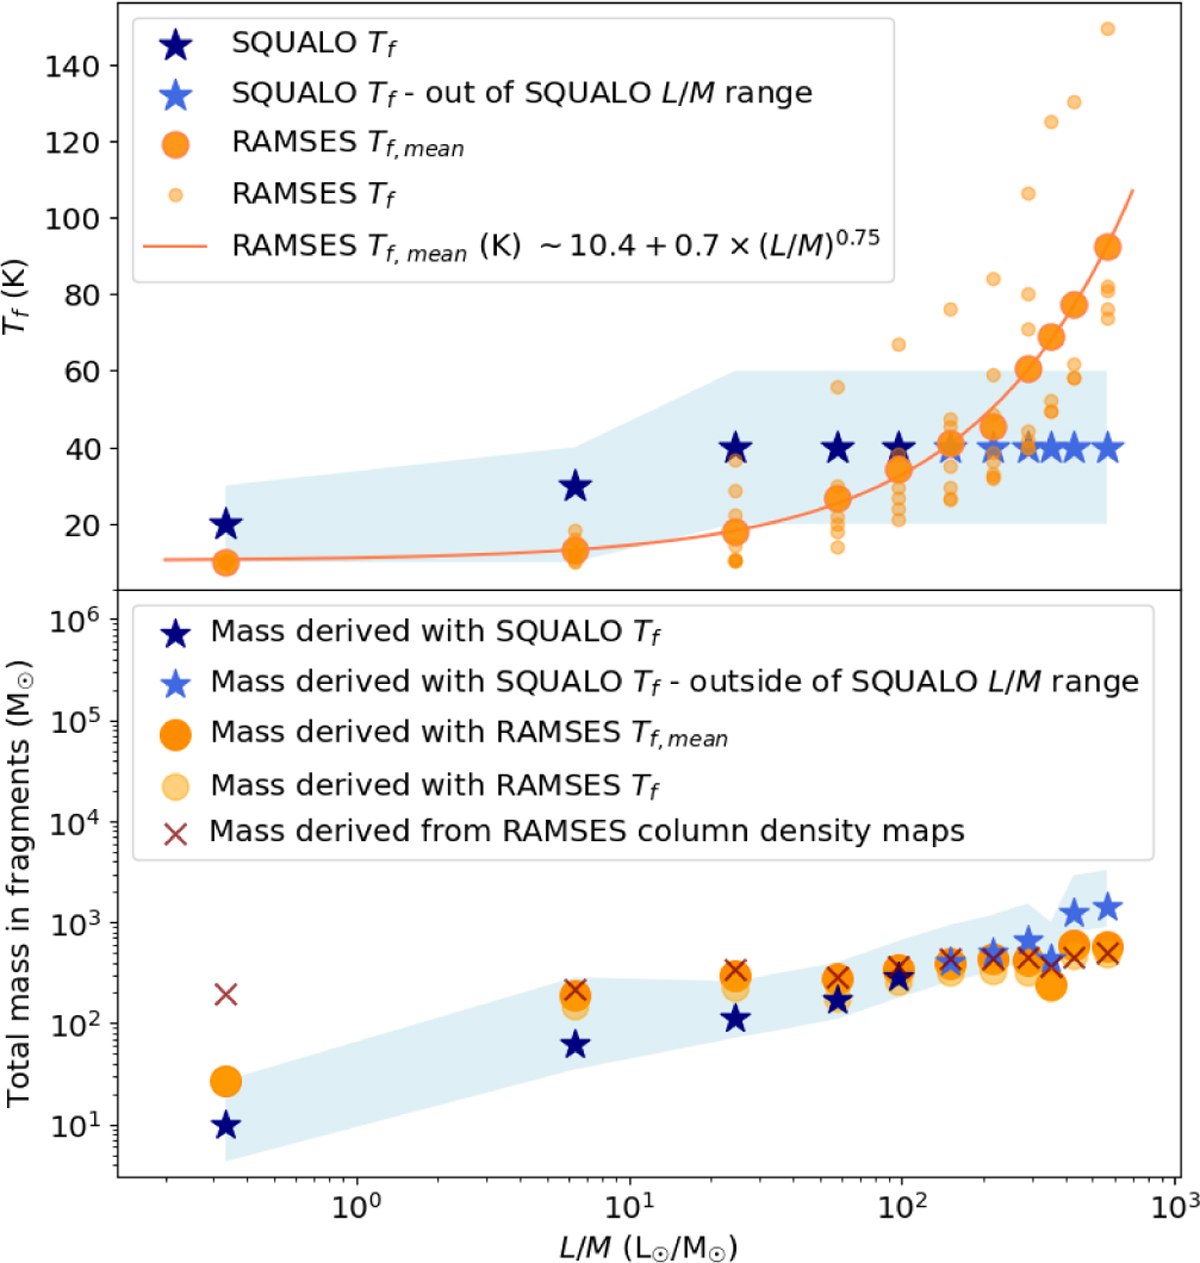
Evolution of fragments temperature (top) and mass (bottom) as a function of the clump L/M for the Μ1000_μ 10_M7_S2 realization. The projection corresponds to the x-axis, i.e. the y - z plane. In the top panel, dark blue stars mark SQUALO reference temperatures according to the evolutionary stage of the clump (see Table 2). Light blue stars mark the reference temperature in the range of L/M not covered by the SQUALO sample. The shaded area corresponds to the temperature ranges used in the 1000 MC simulations of fragments temperature. Small and big orange dots mark, at each given time step, the RAMSES individual temperature of the identified fragments and the RAMSES mean temperature computed across all fragments in the same synthetic field, respectively. The fit of the RAMSES mean temperature as a function of clump L/M is provided as a reference and corresponds to the orange solid line. In the bottom panel, stars and dots indicate mass estimates obtained using the temperatures in the top panel (same color code). Red crosses indicate the mass estimates obtained by integrating the column density maps from the RAMSES simulations within the areas corresponding to the footprints of the identified fragments.
Current usage metrics show cumulative count of Article Views (full-text article views including HTML views, PDF and ePub downloads, according to the available data) and Abstracts Views on Vision4Press platform.
Data correspond to usage on the plateform after 2015. The current usage metrics is available 48-96 hours after online publication and is updated daily on week days.
Initial download of the metrics may take a while.