Fig. 5
Download original image
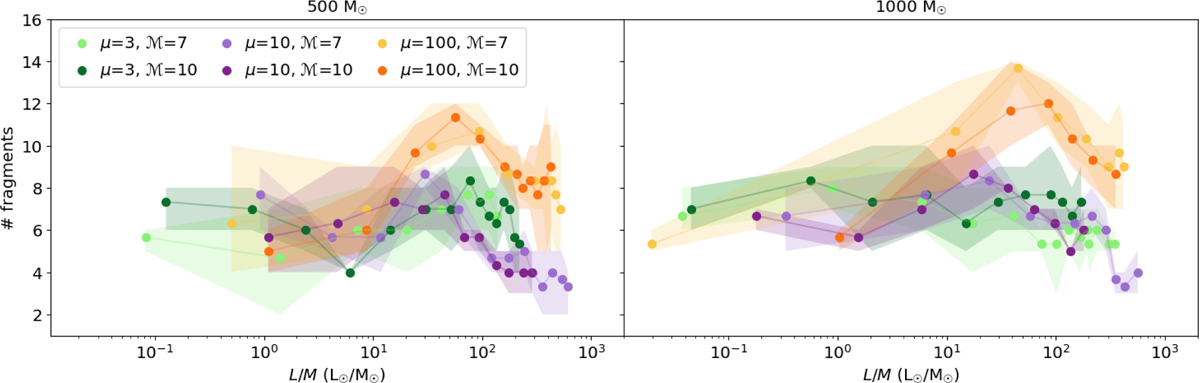
Number of fragments identified in each clump as a function of the clump L/M. Left: realizations with initial clump mass of 500 M⊙. Right: realizations with initial clump mass of 1000 M⊙. Shaded areas illustrate the range in number of fragments recovered across the three projections, indicating the uncertainty in the distribution. The color code accounts for the different initial conditions of the realizations, with particular interest on the values assumed by the μ parameter: μ = 3 for the green dots, μ = 10 for the purple dots, and μ = 100 for the orange dots, respectively.
Current usage metrics show cumulative count of Article Views (full-text article views including HTML views, PDF and ePub downloads, according to the available data) and Abstracts Views on Vision4Press platform.
Data correspond to usage on the plateform after 2015. The current usage metrics is available 48-96 hours after online publication and is updated daily on week days.
Initial download of the metrics may take a while.