Fig. 6
Download original image
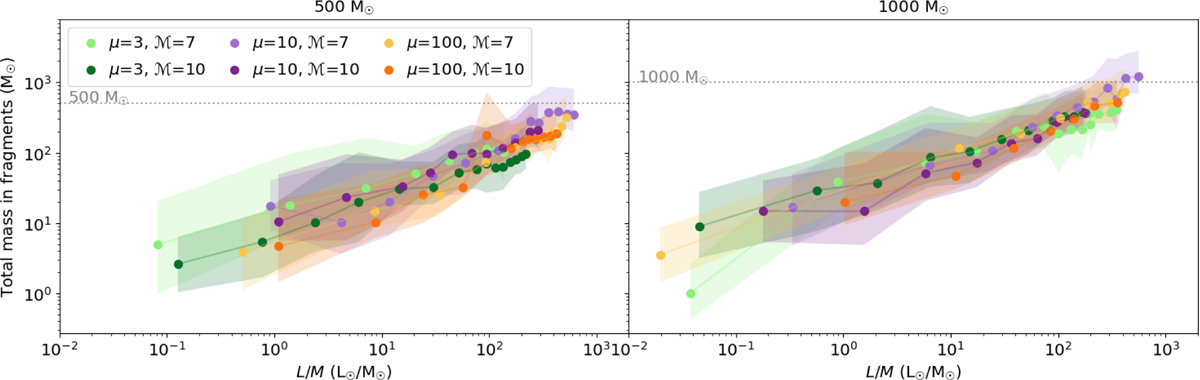
Total mass accreted onto the fragments as a function of the clump L/M. Left: realizations with initial clump mass of 500 M⊙. Right: realizations with initial clump mass of 1000 M⊙. The temperature of each fragment used to convert the fluxes into total mass (scatter plot) has been assigned using MC simulations, following the ranges in Table 2. The span in mass marked by the shaded areas accounts for stochastic variations due to 1000 different MC runs. The color code accounts for the different initial conditions of the realizations, as described in Fig. 5. The horizontal dashed lines correspond to the initial condition on the clump mass: 500 and 1000 M⊙, respectively.
Current usage metrics show cumulative count of Article Views (full-text article views including HTML views, PDF and ePub downloads, according to the available data) and Abstracts Views on Vision4Press platform.
Data correspond to usage on the plateform after 2015. The current usage metrics is available 48-96 hours after online publication and is updated daily on week days.
Initial download of the metrics may take a while.