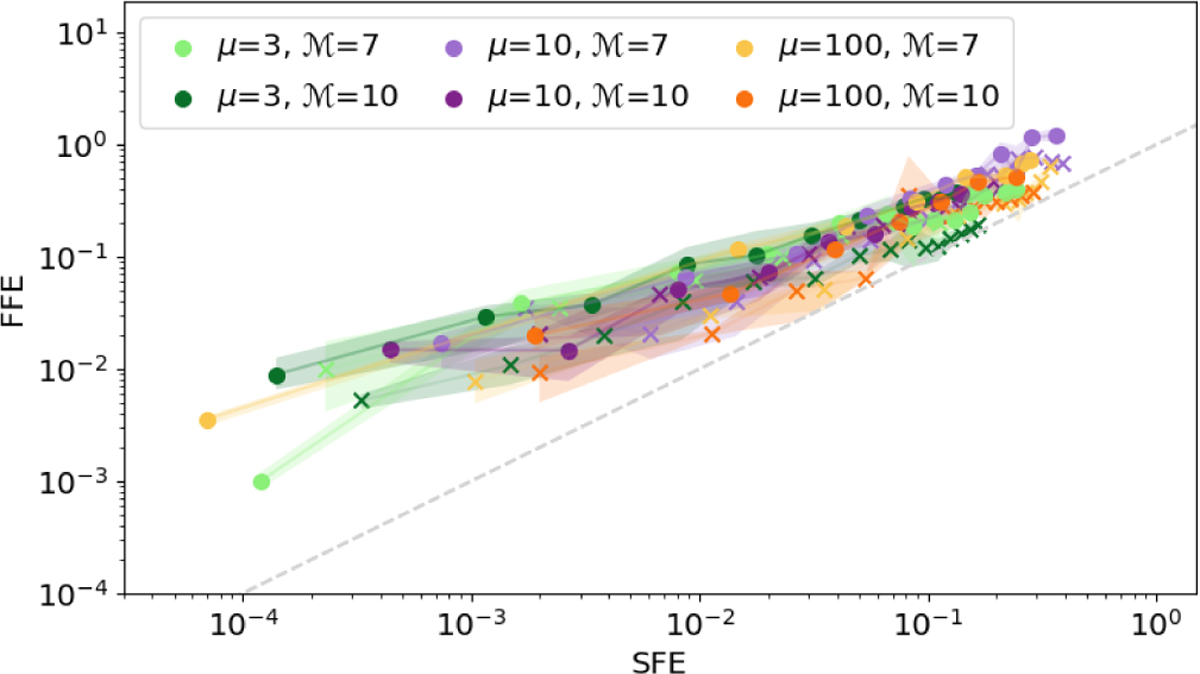
Fig. 8
Download original image
Fragment formation efficiency vs. sink formation efficiency. The color code accounts for the different initial conditions of the realizations, as described in Fig. 5. Specifically, the crosses and the points mark the M500 and M1000 realizations, respectively. Shaded areas illustrate the range in FFE recovered across the three projections, indicating the uncertainty in the distribution. The diagonal dashed line marks the equality between fragment formation efficiency and sink formation efficiency. Data points are expected to lay above the line. Only if the sink particles were resolved, the fragment formation efficiency could align with the one measured for the sinks.
Current usage metrics show cumulative count of Article Views (full-text article views including HTML views, PDF and ePub downloads, according to the available data) and Abstracts Views on Vision4Press platform.
Data correspond to usage on the plateform after 2015. The current usage metrics is available 48-96 hours after online publication and is updated daily on week days.
Initial download of the metrics may take a while.