Fig. 11
Download original image
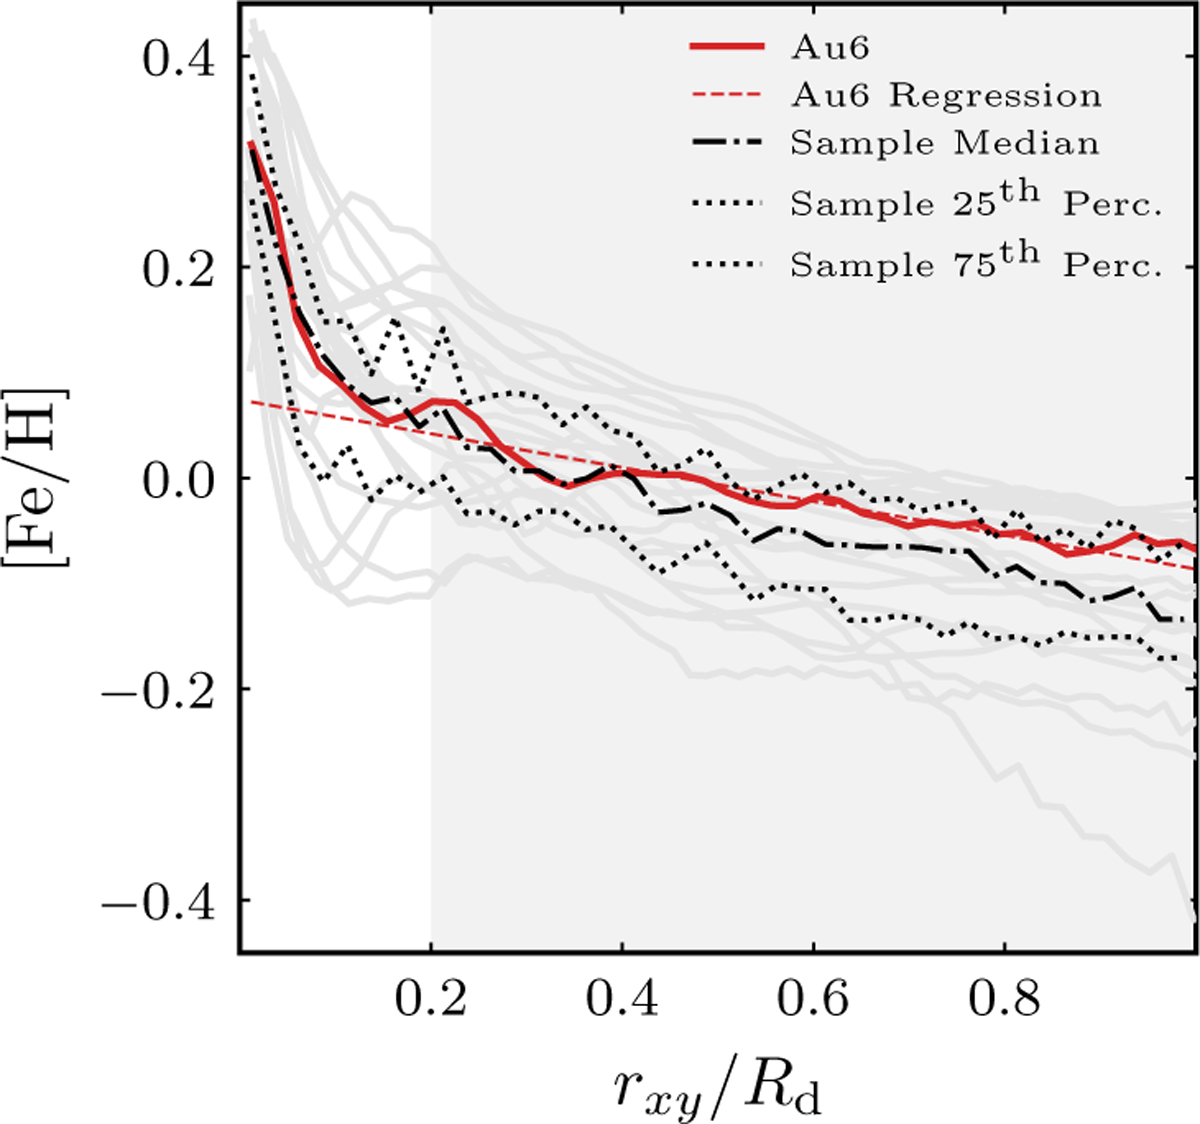
[Fe/H] abundance profiles for the stars in the cold disc. Each grey line represents a galaxy in the sample, with Au6 highlighted in red and its linear regression shown as a dashed line. We also show the median over the sample and the 25th and 75th percentiles. The linear regression is performed in the region 0.2Rd ≤ rxy ≤ Rd (shown as a grey area for reference).
Current usage metrics show cumulative count of Article Views (full-text article views including HTML views, PDF and ePub downloads, according to the available data) and Abstracts Views on Vision4Press platform.
Data correspond to usage on the plateform after 2015. The current usage metrics is available 48-96 hours after online publication and is updated daily on week days.
Initial download of the metrics may take a while.