Fig. 12
Download original image
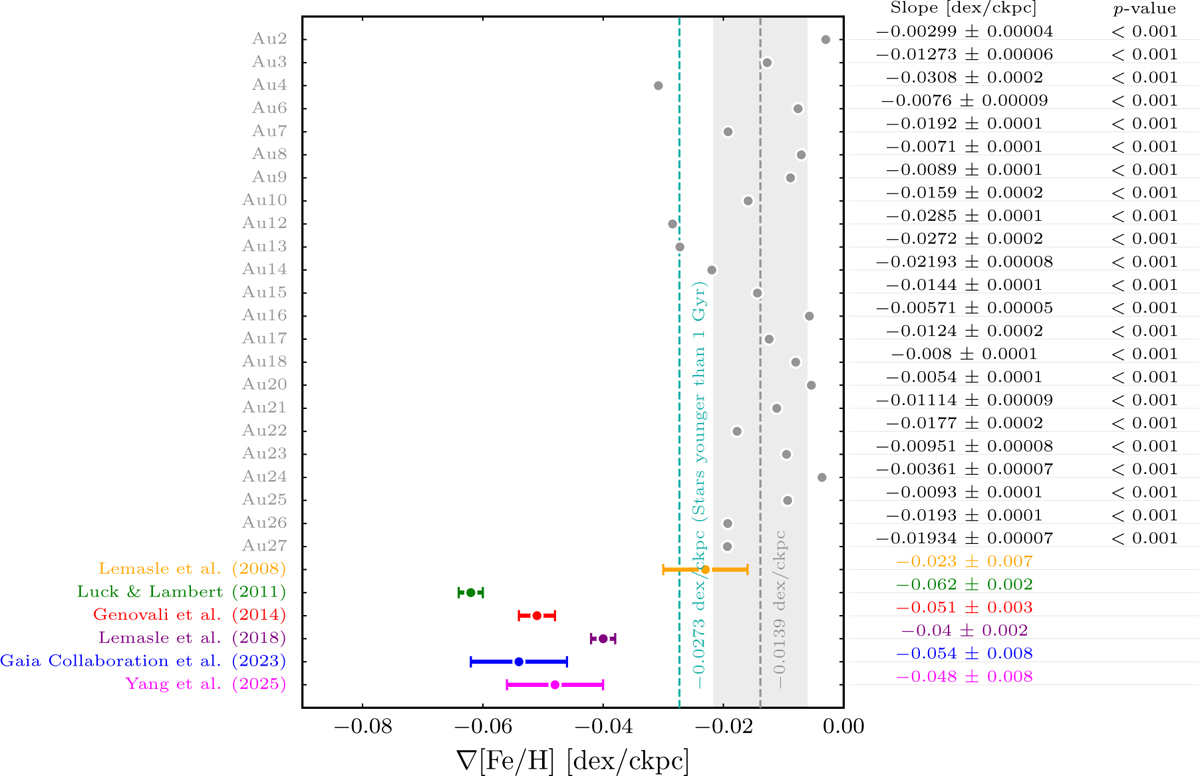
Comparison of the [Fe/H] abundance gradients for the stars in the cold disc, corresponding to the linear regressions of Fig. 11, to available observational estimates. The vertical dashed line indicates the average value of the Auriga sample, for all stars (grey) and stars younger than 1 Gyr (cyan). On the right, we indicate the value of each gradient and its standard error along with the p-value of the fit.
Current usage metrics show cumulative count of Article Views (full-text article views including HTML views, PDF and ePub downloads, according to the available data) and Abstracts Views on Vision4Press platform.
Data correspond to usage on the plateform after 2015. The current usage metrics is available 48-96 hours after online publication and is updated daily on week days.
Initial download of the metrics may take a while.