Fig. 13
Download original image
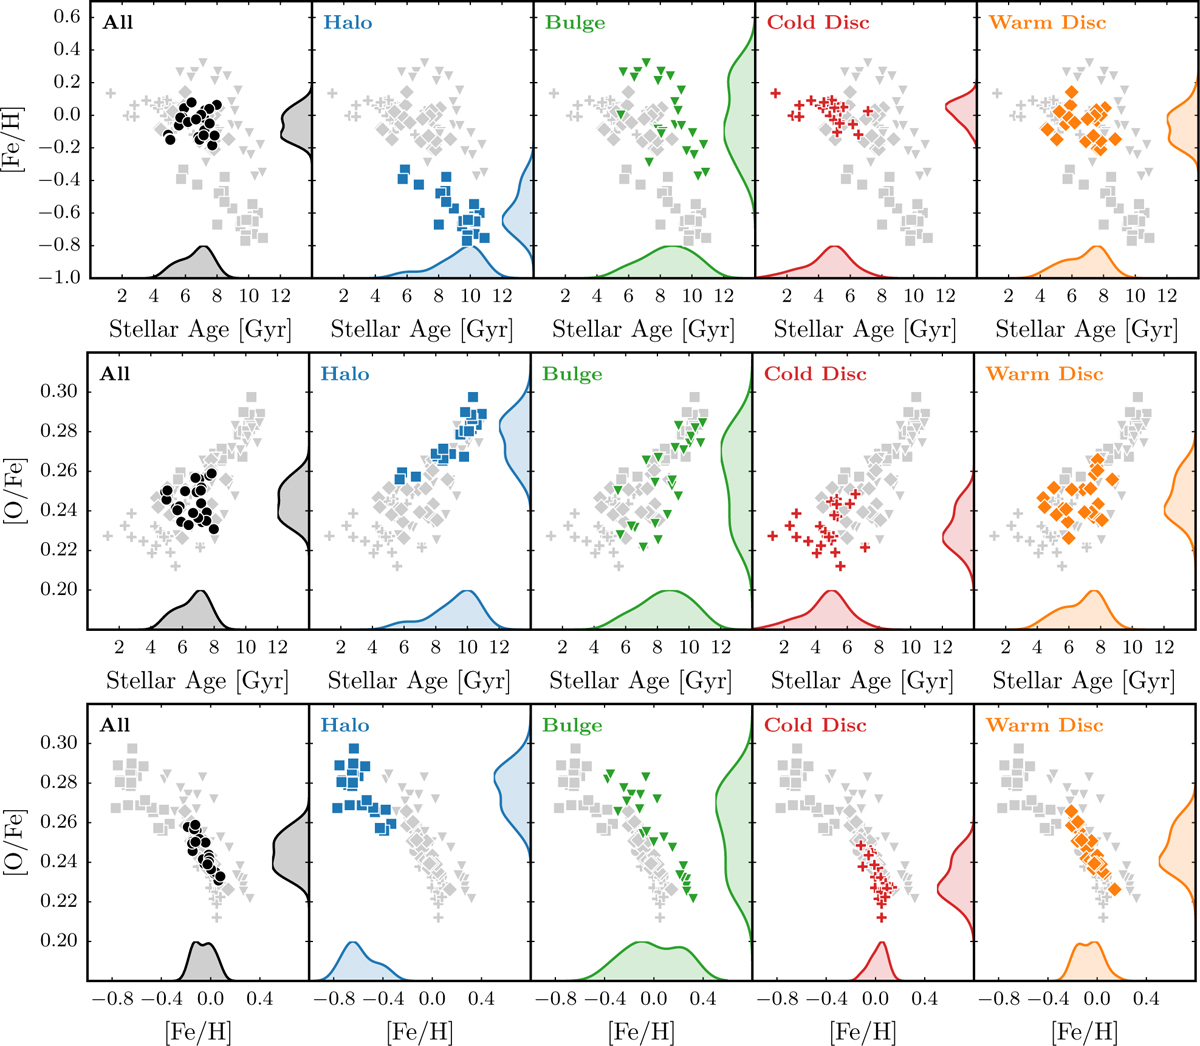
Top: median [Fe/H] abundance vs. median stellar age at z = 0. Each point in these scatter plots is a galaxy, and each panel highlights one galactic component in colour. Halo, bulge, cold disc, and warm disc are shown in blue, green, red and orange, respectively. The grey symbols in the background show the values for all components. For reference, we also show the probability distribution for each axis as a filled line plot. Middle: same as the top panels but for the [O/Fe] abundance. Bottom: median [O/Fe] abundance vs. median [Fe/H] abundance at z = 0. Each point in these scatter plots is a galaxy, and each panel highlights one galactic component in colour. Halo, bulge, cold disc, and warm disc are shown in blue, green, red and orange, respectively. The grey dots in the background show the values for all components. For reference, we also show the probability distribution for each axis as a filled line plot.
Current usage metrics show cumulative count of Article Views (full-text article views including HTML views, PDF and ePub downloads, according to the available data) and Abstracts Views on Vision4Press platform.
Data correspond to usage on the plateform after 2015. The current usage metrics is available 48-96 hours after online publication and is updated daily on week days.
Initial download of the metrics may take a while.