Fig. 14
Download original image
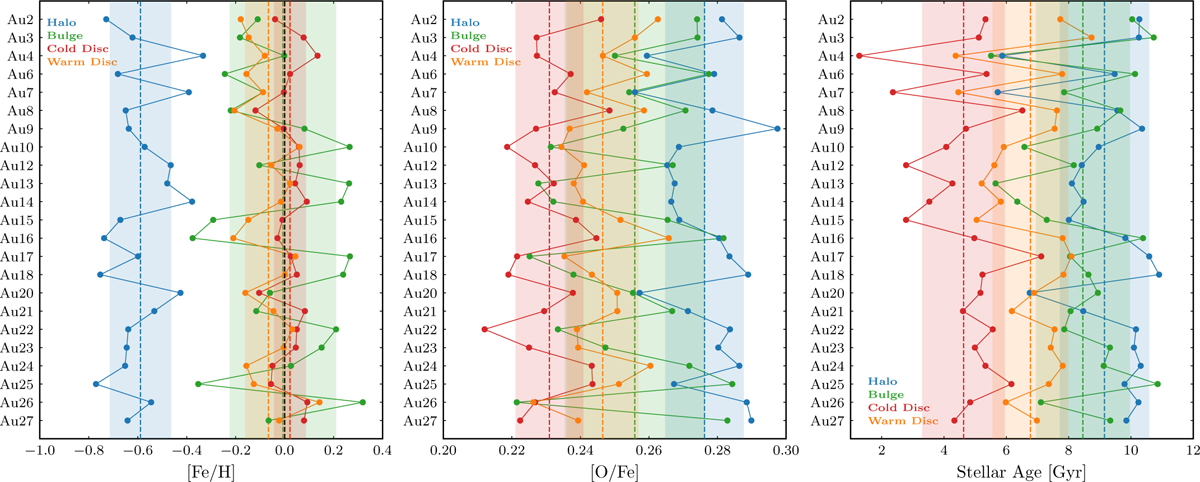
Mean values of [Fe/H], [O/Fe] and stellar age of all the galaxies in the sample, ordered by galaxy. Each dot indicates the value of an observable for a given galaxy, colour-coded by component, while the dashed vertical lines shows the average over the sample. Shaded areas indicate the ±1σ region. We note that the solid lines that join the data points are included for visualisation purposes but lack any intrinsic meaning.
Current usage metrics show cumulative count of Article Views (full-text article views including HTML views, PDF and ePub downloads, according to the available data) and Abstracts Views on Vision4Press platform.
Data correspond to usage on the plateform after 2015. The current usage metrics is available 48-96 hours after online publication and is updated daily on week days.
Initial download of the metrics may take a while.