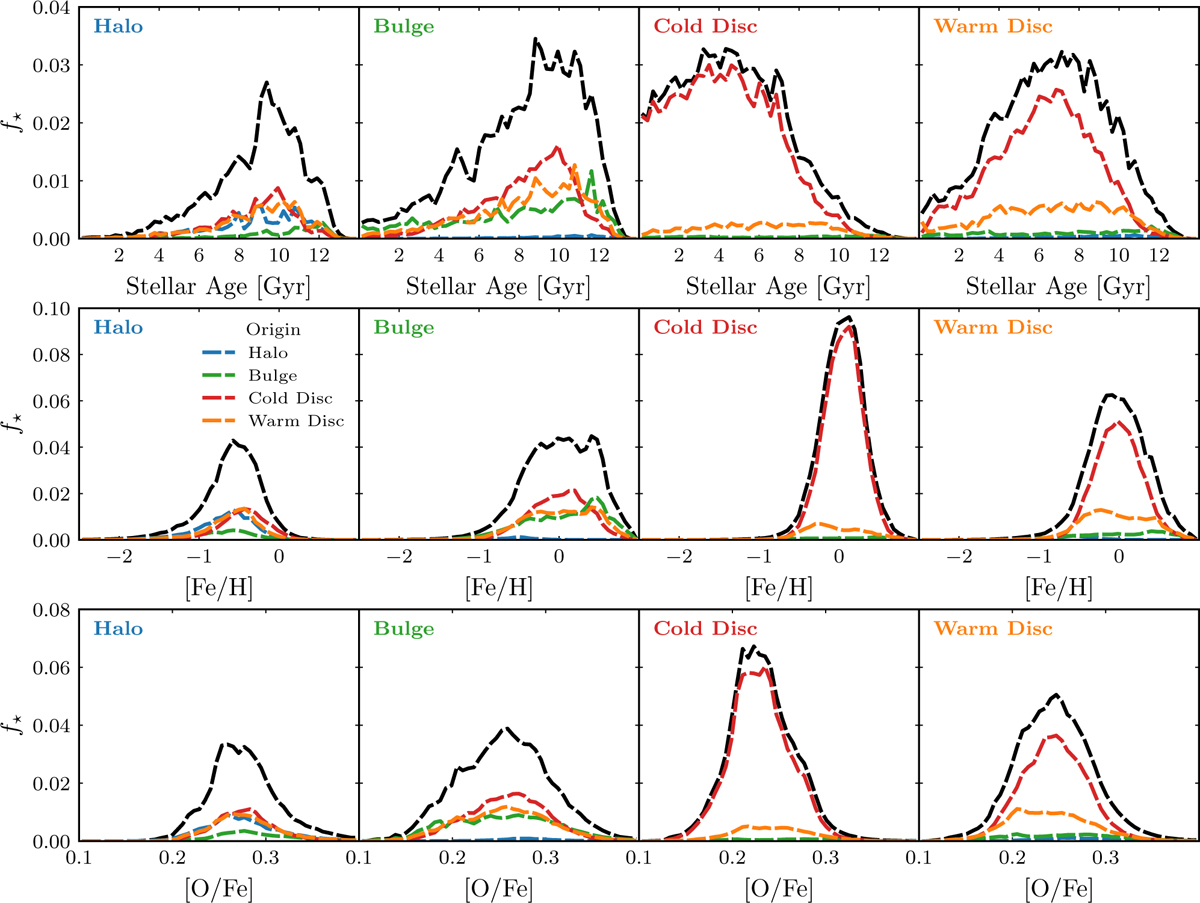
Fig. 16
Download original image
Median distribution of stellar ages, [Fe/H] abundance, and [O/Fe] abundance for the sample of galaxies, separated by the component at birth. In each panel, the black dashed line shows the distribution of the in situ stars for each component for reference. This line corresponds to the line with the same style in Fig. 15. Top: distribution of the stars that reside in each component at z = 0 (in situ stars), separated by the component they inhabited at the time of birth. The red line in the first panel, for example, shows the distribution of stellar ages for the stars that populate the halo at z = 0 but that were born in the cold disc. The green line in the fourth panel, on the other hand, shows the distribution of stellar ages for the stars that reside in the warm disc at z = 0 but were born in the bulge. Middle: same as the top row, but for the [Fe/H] abundance. Bottom: same as the top row, but for the [O/Fe] abundance.
Current usage metrics show cumulative count of Article Views (full-text article views including HTML views, PDF and ePub downloads, according to the available data) and Abstracts Views on Vision4Press platform.
Data correspond to usage on the plateform after 2015. The current usage metrics is available 48-96 hours after online publication and is updated daily on week days.
Initial download of the metrics may take a while.