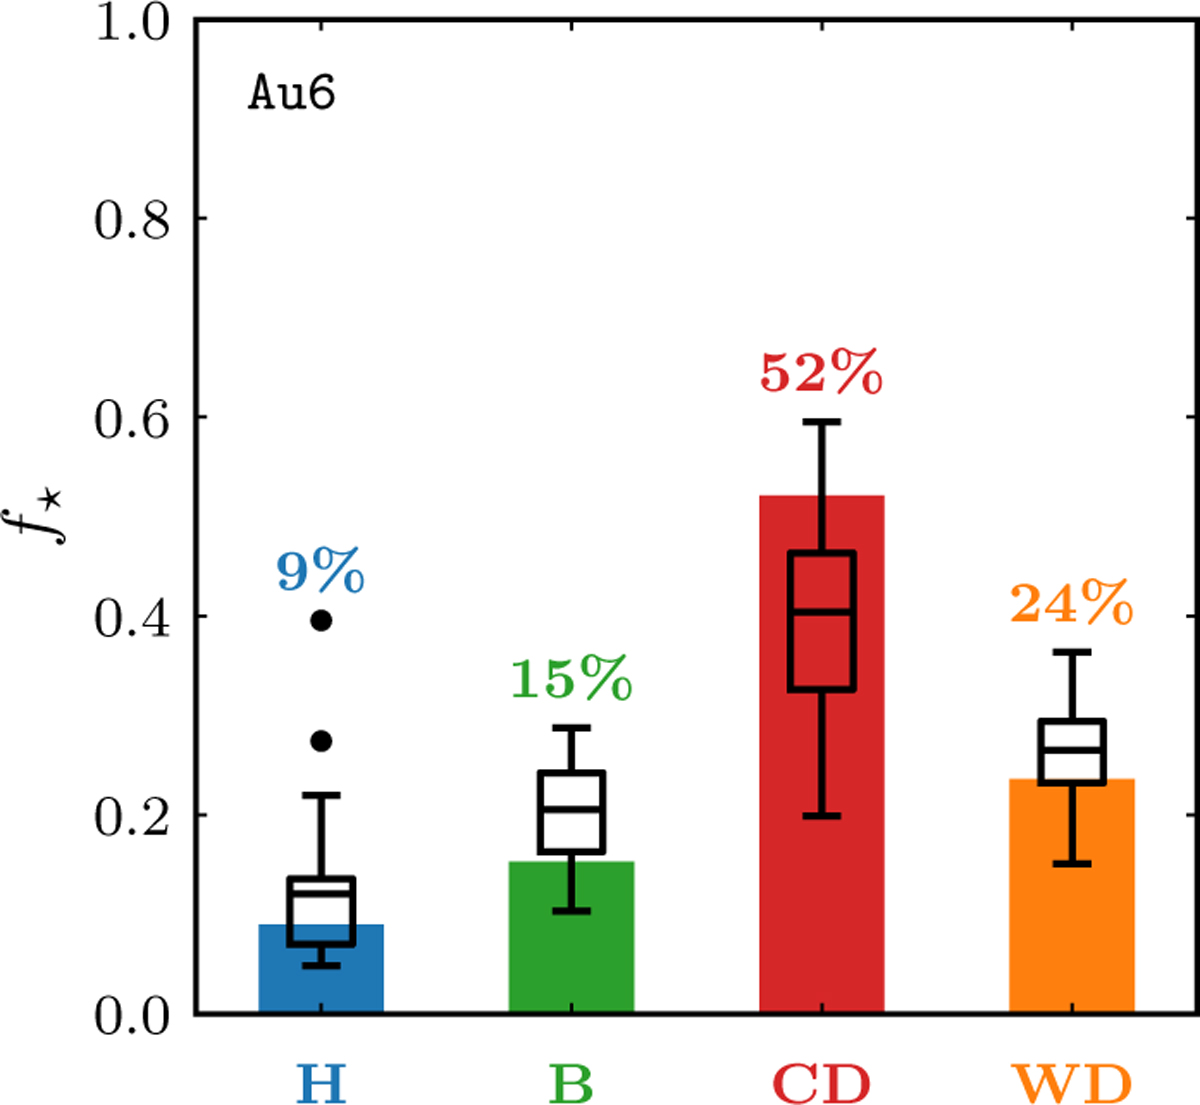
Fig. 4
Download original image
Fraction of the total stellar mass of the galaxy within each galactic component for Au6 at z = 0 (coloured bars). The box plots indicate the statistical properties of the full sample of galaxies. Each box extends from the first quartile to the third quartile and the line inside indicates the value of the median. The whiskers show the values of the farthest data point that is within 3/2 of the inter-quartile range (the size of the box) from the box. Black data points are the values that extend beyond the end of the whiskers.
Current usage metrics show cumulative count of Article Views (full-text article views including HTML views, PDF and ePub downloads, according to the available data) and Abstracts Views on Vision4Press platform.
Data correspond to usage on the plateform after 2015. The current usage metrics is available 48-96 hours after online publication and is updated daily on week days.
Initial download of the metrics may take a while.